The City uses a procure to pay (P2P) process that integrates its purchasing and accounts payable systems. The below metrics summarize key procurement activities, initiatives and performance indicators for processes and expenditures incurred by the City in 2024, with prior years included for comparison.
Source data for these metrics are available on the City’s Open Data portal. More details are available in the supplemental document.
The Purchasing and Materials Management Division (PMMD) is responsible for the commitment of public funds for the acquisition of goods and services. The City provides best value to Toronto taxpayers through the application of open, fair, equitable and accessible business processes and practices. Various solicitation methods are used, including:
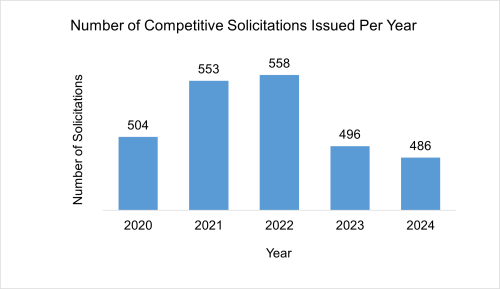
| Solicitations Issued Per Year | 504 | 553 | 558 | 496 | 486 |
|---|---|---|---|---|---|
| 2020 | 2021 | 2022 | 2023 | 2024 |
Average cycle time is the overall time it takes to complete a procurement on average, from initiation of the procurement with Purchasing and Materials Management Division (PMMD) until a purchasing document is issued. Overall, the average cycle time in 2024 remained at 145 working days, unchanged from 2023.
| Cycle Events | 2020 | 2021 | 2022 | 2023 | 2024 |
|---|---|---|---|---|---|
| Initiation of the solicitation, preparation and approval of a solicitation document for issuance | 37.60 | 36.10 | 35.86 | 42.60 | 45.10 |
| Time period between the solicitation issue date and closing date | 22.40 | 21.50 | 23.66 | 24.40 | 24.60 |
| Solicitation closing date and date summary sent to Client Division | 6.00 | 4.90 | 3.80 | 9.10 | 8.70 |
| Divisional evaluation of bids/proposals received | 32.20 | 20.00 | 31.49 | 39.40 | 35.60 |
| Time period from receipt of the recommendation to award to issuance of Purchase Order, which includes entering into legal agreements where required | 34.40 | 22.50 | 25.72 | 29.30 | 31.20 |
| Total Average Time in the Procurement Cycle | 133 | 105 | 121 | 145 | 145 |
In 2024, the value of all non-competitive procurements for the City totaled $266 million, which represents 8.9 per cent of the City’s total procurements of approximately $3 billion. These non-competitive procurements include Purchase Orders (PO), Blanket Contracts (BC) and Divisional Purchase Orders (DPO).
The table below shows a comparison of non-competitive City procurements to total overall procurements for the years 2023 and 2024.
|
2023 Number of Procurements Issued |
2023 Procurement Value | 2024 Number of Procurements Issued | 2024 Procurement Value | |
|---|---|---|---|---|
| Approved by Divisions | 262
(3.1% of Total POs/BCs/DPO issued) |
$5,862,705 (0.2% of Total Purchases) |
243 (2.9% of Total POs/BCs/DPO issued) |
$5,978,100 (0.2% of Total Purchases) |
| Approved by PMMD |
240 (2.9% of Total POs/BCs/DPO issued) |
$44,646,351 (1.8% of Total Purchases) |
162 (2.0% of Total POs/BCs/DPO issued) |
$30,714,340
(1% of Total Purchases) |
| Approved by Council |
60 (0.7% of Total POs/BCs/DPO issued) |
$135,991,085 (5.5% of Total Purchases) |
50 (0.6% of Total POs/BCs/DPO issued) |
$229,201,366
(7.7% of Total Purchases) |
| Total Non-Competitive Activity |
562 (6.7% of Total POs/BCs/DPO issued) |
$186,500,140 (7.5% of Total Purchases) |
455 (5.5% of Total POs/BCs/DPO issued) |
$265,893,805
(8.9% of Total Purchases) |
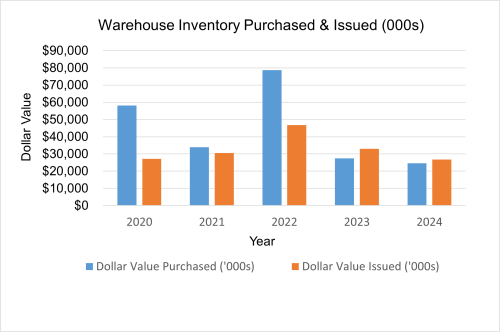
The City’s Materials Management Unit runs the corporate warehouses. It monitors and works to maintain a balance between the value of stock issued and the value of goods received.
Overall, the value of warehouse inventory increased over the five-year period from 2020 through 2024.
| Warehouse Inventory Type | 2020 | 2021 | 2022 | 2023 | 2024 |
|---|---|---|---|---|---|
| Dollar Value Purchased (000s) | $58,158 | $33,910 | $78,678 | $27,448 | $24,549 |
| Dollar Value Issued (000s) | $27,120 | $30,575 | $46,747 | $32.992 | $26,774 |
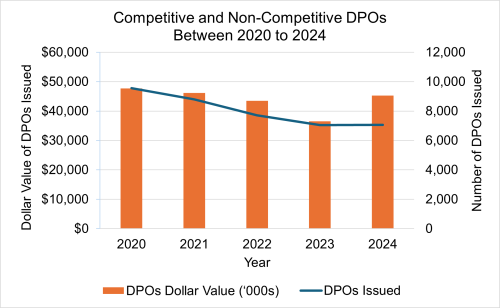
In 2024, the City issued over 7,057 Divisional Purchase Orders (DPOs) valued at approximately $45.3 million, of which 243 DPOs valued at $6 million were processed as non-competitive procurements.
In 2024, there was an increase of 8 DPOs compared to 2023, and the dollar value of purchases made by DPOs increased by $8.7 million from $36.5 million.
| Divisional Purchase Order (DPO) Information | 2020 | 2021 | 2022 | 2023 | 2024 |
|---|---|---|---|---|---|
| DPOs Dollar Value (‘000s) | $47,692 | $46,126 | $43,471 | $36,515 | $45,250 |
| DPOs Issued | 9,553 | 8,792 | 7,705 | 7,049 | 7,057 |
For historic procurement metrics with the City, please see the 2023 Procurement Metrics supplemental document.