A ward’s Child Care Fee Subsidy Target is calculated by dividing the total number of available subsidies (based on the City’s approved budget) by the ward’s proportion of Toronto’s low-income children (a child is considered low-income if their family is living below Statistics Canada's Low-Income Measure, after tax).
For example, If a ward has 5% of Toronto’s low-income children, they are entitled to have 5% of the available subsidies. Within each ward, subsidies are then allocated to age groups (infant, toddler, preschool, kindergarten & school age) based on the proportion of children in each group.
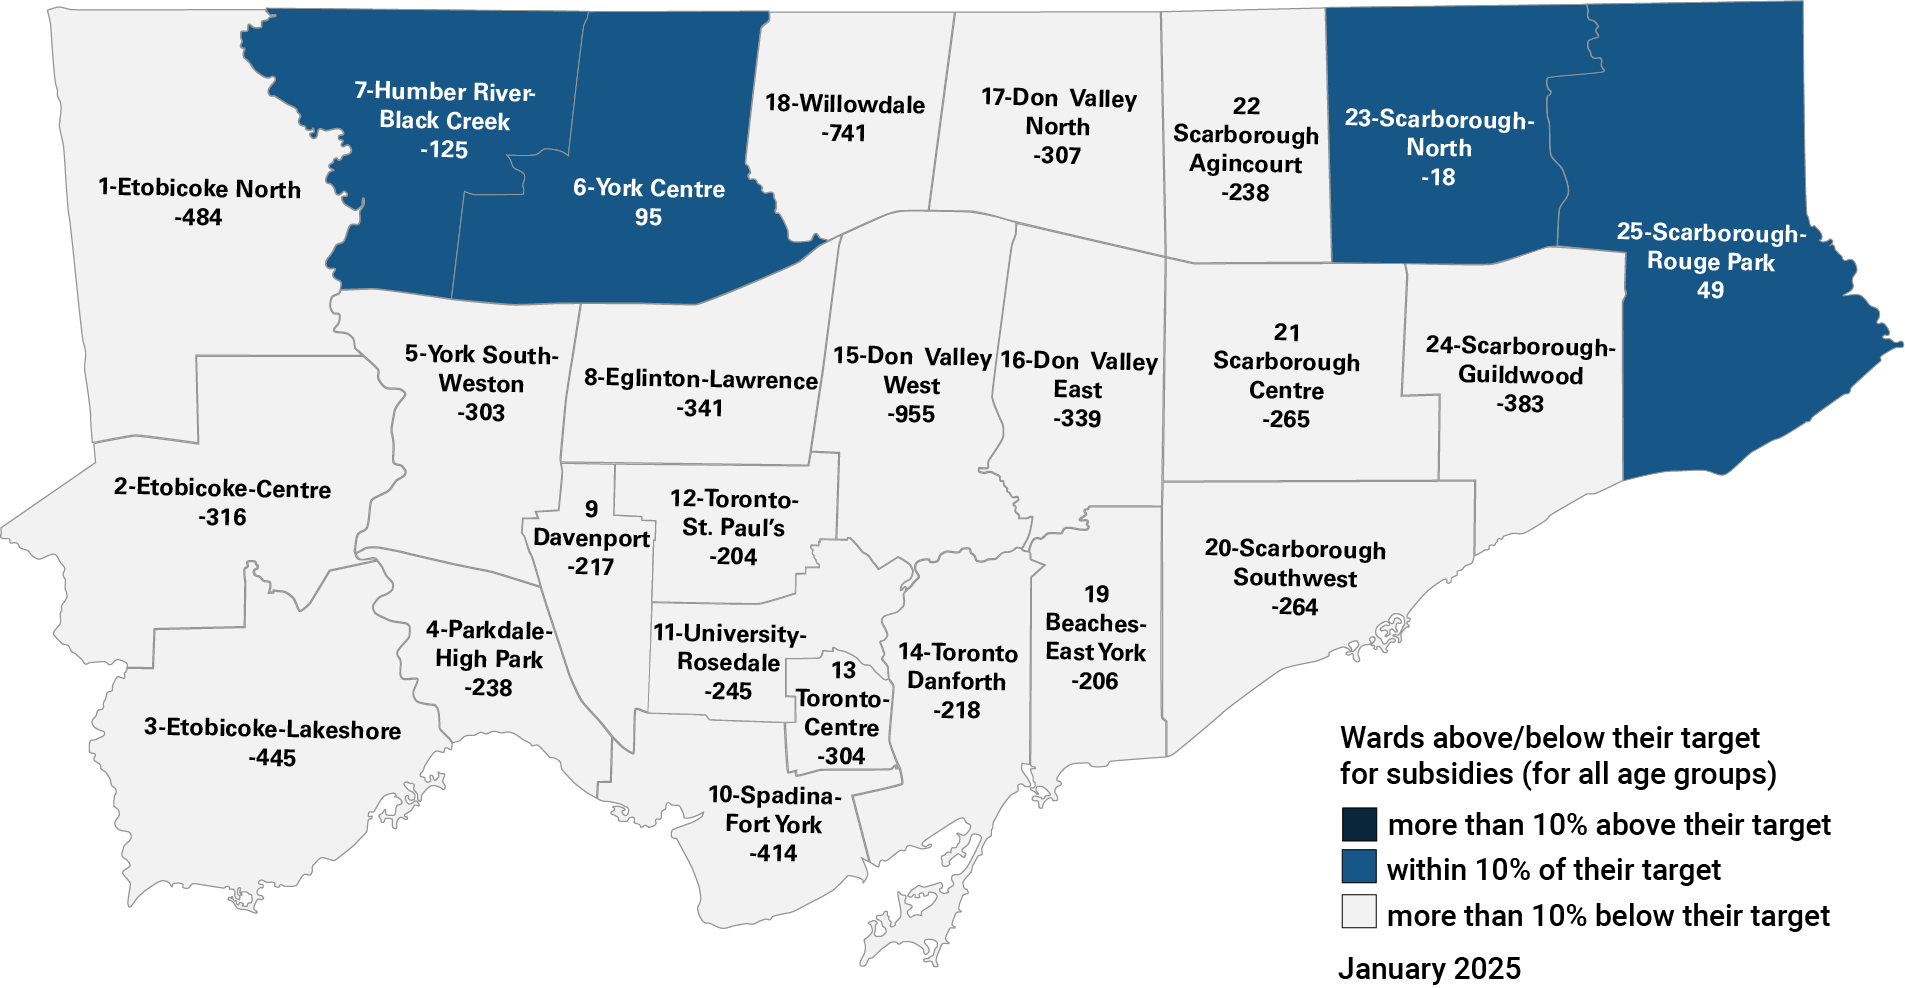
The following map and data tables show how close each ward is to their subsidy target.
| Ward Number | Ward | All age groups | Infant | Toddler | Preschool | Kindergarten | School Age |
|---|---|---|---|---|---|---|---|
| 1 | Etobicoke North | -484 | -59 | -15 | 107 | -217 | -300 |
| 2 | Etobicoke Centre | -316 | -20 | -15 | -4 | -63 | -214 |
| 3 | Etobicoke-Lakeshore | -445 | -99 | -68 | 13 | -130 | -161 |
| 4 | Parkdale-High Park | -238 | -51 | -25 | 18 | -38 | -142 |
| 5 | York South-Weston | -303 | -68 | 51 | 89 | -101 | -274 |
| 6 | York Centre | 95 | -27 | 59 | 94 | 40 | -71 |
| 7 | Humber River-Black Creek | -125 | -19 | 51 | 111 | -52 | -216 |
| 8 | Eglinton-Lawrence | -341 | -62 | -9 | 23 | -120 | -173 |
| 9 | Davenport | -217 | -31 | 18 | 14 | -71 | -147 |
| 10 | Spadina-Fort York | -414 | -73 | -84 | -15 | -89 | -153 |
| 11 | University-Rosedale | -245 | -32 | -36 | -21 | -74 | -82 |
| 12 | Toronto-St. Paul's | -204 | -42 | -29 | 11 | -50 | -94 |
| 13 | Toronto Centre | -304 | -63 | -14 | 69 | -134 | -162 |
| 14 | Toronto-Danforth | -218 | -18 | -11 | 22 | -23 | -188 |
| 15 | Don Valley West | -955 | -88 | -89 | -82 | -185 | -511 |
| 16 | Don Valley East | -339 | -100 | -39 | 36 | -98 | -138 |
| 17 | Don Valley North | -307 | -69 | -31 | 42 | -63 | -186 |
| 18 | Willowdale | -741 | -91 | -66 | -26 | -207 | -351 |
| 19 | Beaches-East York | -206 | -52 | 1 | 70 | -46 | -179 |
| 20 | Scarborough Southwest | -264 | -30 | -11 | 39 | -58 | -204 |
| 21 | Scarborough Centre | -265 | -33 | 9 | 104 | -77 | -268 |
| 22 | Scarborough-Agincourt | -238 | -75 | -6 | 88 | -115 | -130 |
| 23 | Scarborough North | -18 | -33 | -1 | 114 | -38 | -60 |
| 24 | Scarborough-Guildwood | -383 | -48 | 12 | 104 | -115 | -336 |
| 25 | Scarborough-Rouge Park | 49 | 14 | 37 | 113 | 5 | -120 |
| Ward Number | Ward | All age groups | Infant | Toddler | Preschool | Kindergarten | School Age |
|---|---|---|---|---|---|---|---|
| 1 | Etobicoke North | below | below | at | above | below | below |
| 2 | Etobicoke Centre | below | below | below | at | below | below |
| 3 | Etobicoke-Lakeshore | below | below | below | at | below | below |
| 4 | Parkdale-High Park | below | below | below | above | below | below |
| 5 | York South-Weston | below | below | above | above | below | below |
| 6 | York Centre | at | below | above | above | above | below |
| 7 | Humber River-Black Creek | at | below | above | above | below | below |
| 8 | Eglinton-Lawrence | below | below | at | above | below | below |
| 9 | Davenport | below | below | above | above | below | below |
| 10 | Spadina-Fort York | below | below | below | at | below | below |
| 11 | University-Rosedale | below | below | below | below | below | below |
| 12 | Toronto-St. Paul's | below | below | below | at | below | below |
| 13 | Toronto Centre | below | below | at | above | below | below |
| 14 | Toronto-Danforth | below | below | below | above | below | below |
| 15 | Don Valley West | below | below | below | below | below | below |
| 16 | Don Valley East | below | below | below | above | below | below |
| 17 | Don Valley North | below | below | below | above | below | below |
| 18 | Willowdale | below | below | below | below | below | below |
| 19 | Beaches-East York | below | below | at | above | below | below |
| 20 | Scarborough Southwest | below | below | at | above | below | below |
| 21 | Scarborough Centre | below | below | at | above | below | below |
| 22 | Scarborough-Agincourt | below | below | at | above | below | below |
| 23 | Scarborough North | at | below | at | above | below | below |
| 24 | Scarborough-Guildwood | below | below | at | above | below | below |
| 25 | Scarborough-Rouge Park | at | above | above | above | at | below |