Toronto Maps is an internet mapping web application created for use by the general public. The interface provides a window to explore the geography of the city of Toronto, search for specific locations and retrieve detailed information about various geographic features within the City. The data presented within the application is provided by numerous stakeholders including City of Toronto divisions, agencies, boards and commissions.
All data presented is published from source systems of record and is curated with a focus on accuracy, currency, consistency, and completeness.
While we aim to provide fully accessible content, there is presently no text-based alternative available for some of the content on this site. If you require alternate formats or need assistance understanding these maps, drawings or any other content, please contact us at gcc@toronto.ca
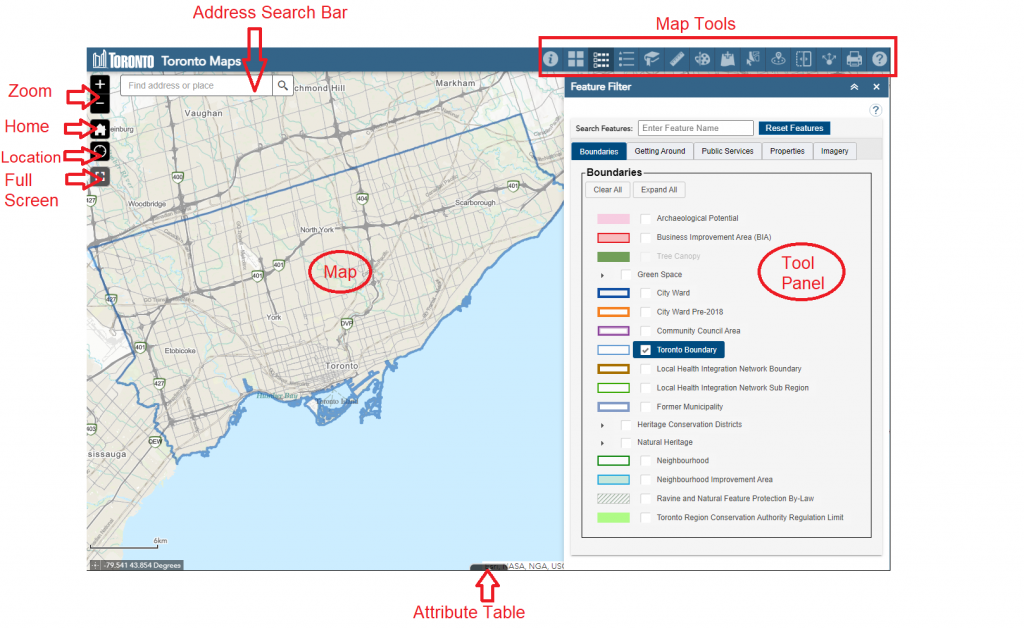
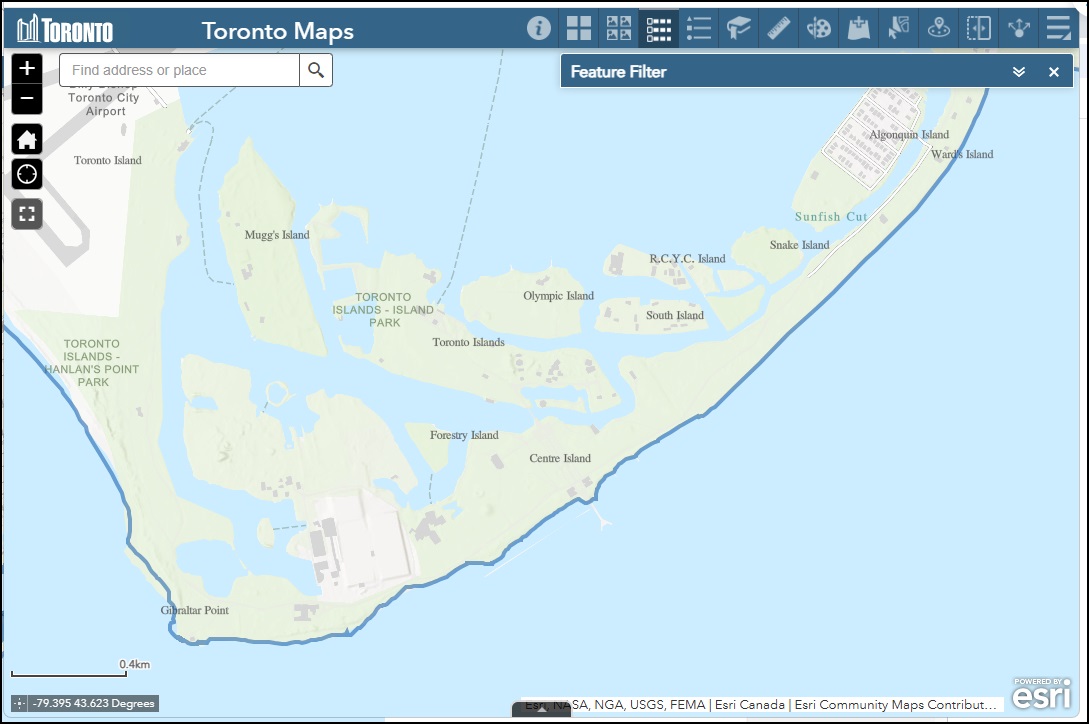
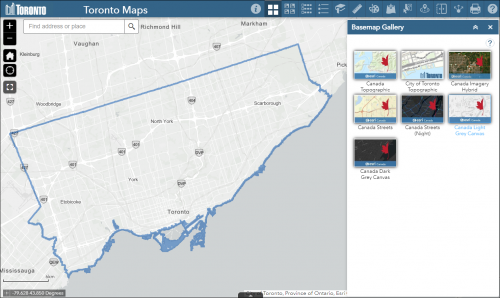
When you first bring up Toronto Maps, it displays a map of the entire City and its surrounding area. Toronto Maps is comprised of the following components, identified on the image below: Map Tools, Zoom Tools, Tool Panel, Address Search Bar, and the main Map window.
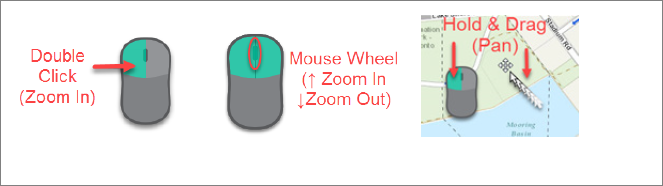
Using Your Mouse
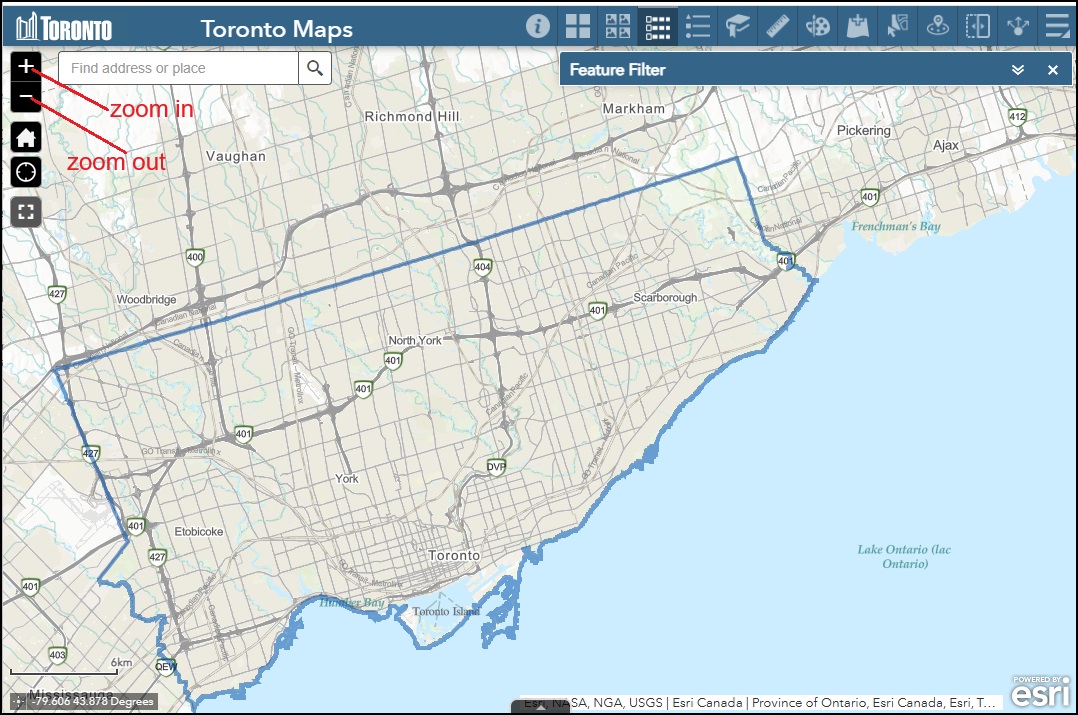
Using the Zoom In/Out buttons
You may zoom in by clicking “+” and out by clicking “-“, as shown below.
You can also draw a box to zoom in quickly
Left click the “+” button
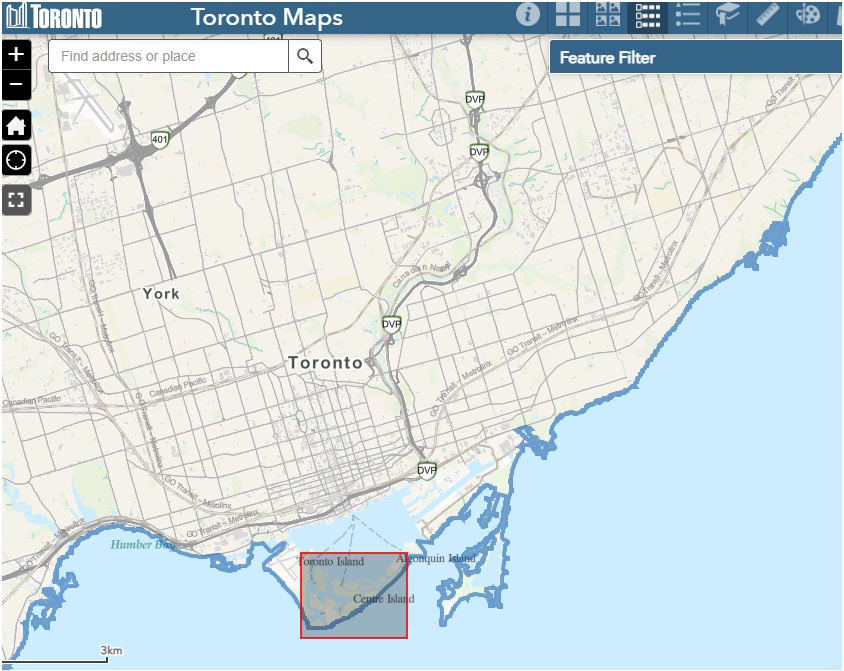
The map zooms to the area highlighted by the zoom box.
Default Extent
This “Home” button returns the map to the original startup zoom level, showing the entire city.
My Location
Allows the Toronto Maps application access to your current location. This is particularly useful if using the application on a mobile device, to simplify and improve the functionality of tools such as “Near Me”. A popup message will appear to prompt you to accept or decline this functionality when you first select this tool.
Full Screen
Displays the Toronto Maps application in full screen mode.
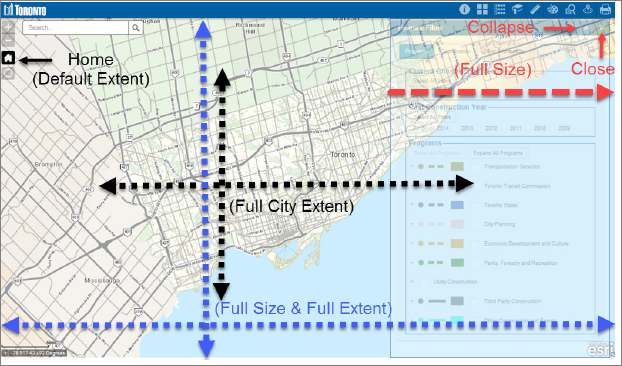
Getting Full Size Map
When you launch Toronto Maps, the map will show the Full City Extent by default. You may zoom in, zoom out and pan the map during your session, and go back to the Default Extent by clicking the Home button. The Default Extent is the Full City Extent when you start the session. If you need more space to display more features, you may want to view the Full Size map by collapsing or closing the Tool Panel.
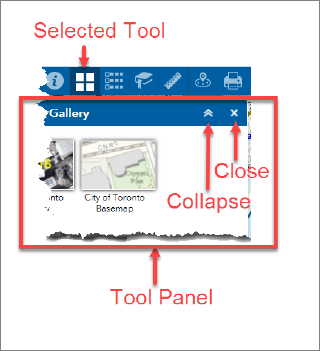
Opening and Closing Tools
When you select a tool, it will be displayed on the right side of the map (Tool Panel) as indicated in the image. You can click the X button to close, or the button to collapse the Tool Panel. These actions allow you to have more space for the map (see Getting Full Size Map below). When you select another tool, it will open in the Tool Panel area. You can open one tool at the time.
![]()
1. ![]() About: Provides general information on Toronto Maps application, including contact information.
About: Provides general information on Toronto Maps application, including contact information.
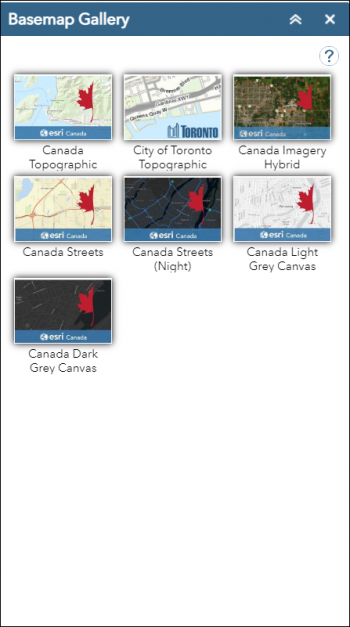
2. ![]() Basemap Gallery: Toronto Maps can have a street map, topographic, dark or light grey map for its background. Choose the background from the Basemap Gallery.
Basemap Gallery: Toronto Maps can have a street map, topographic, dark or light grey map for its background. Choose the background from the Basemap Gallery.
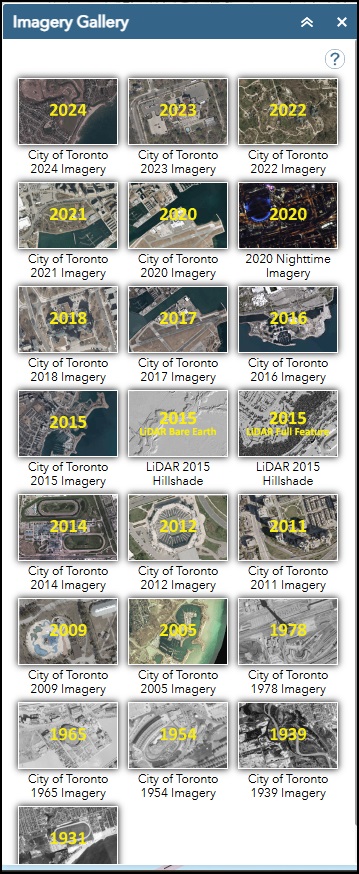
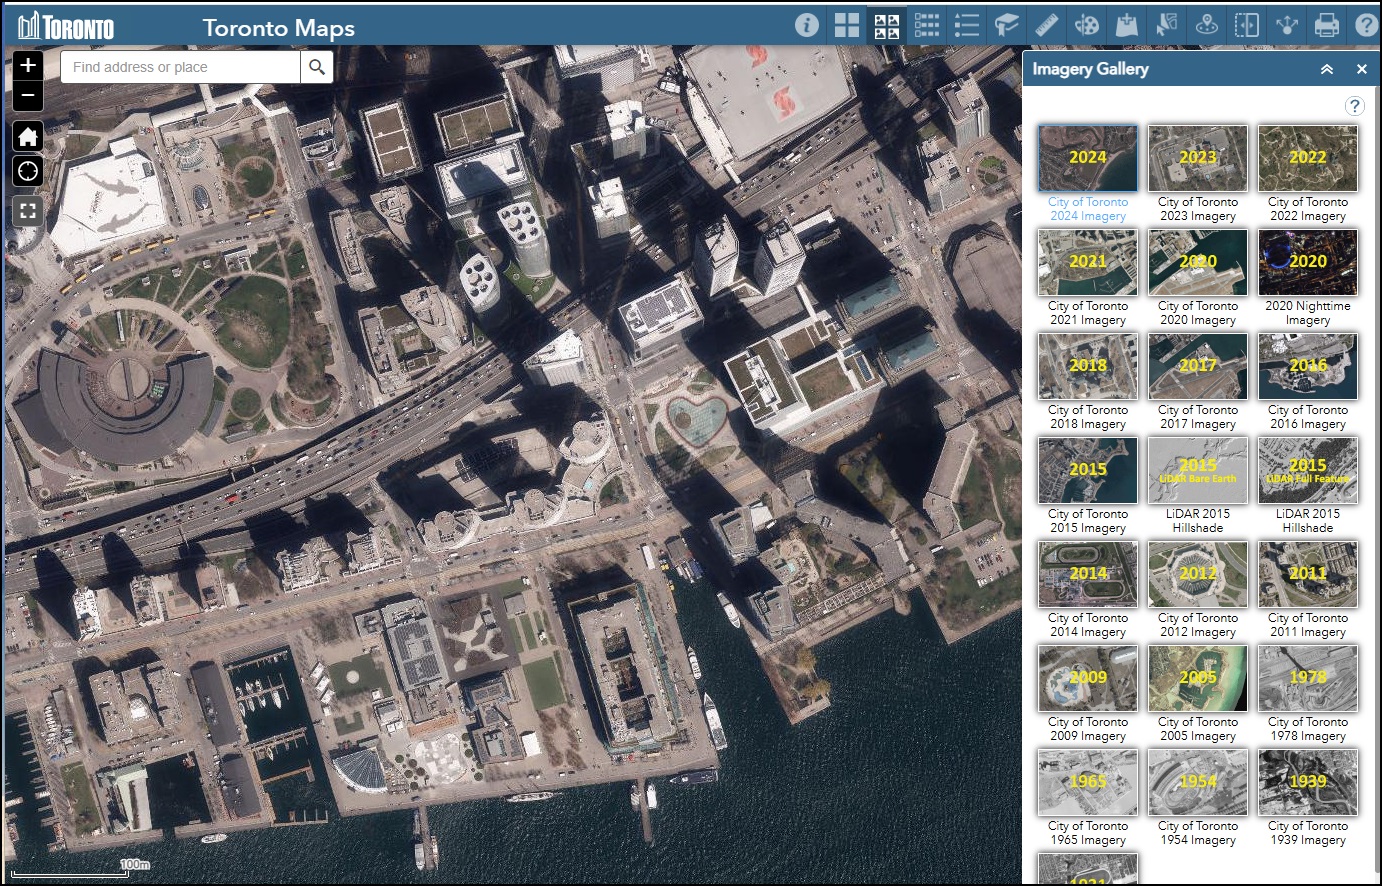
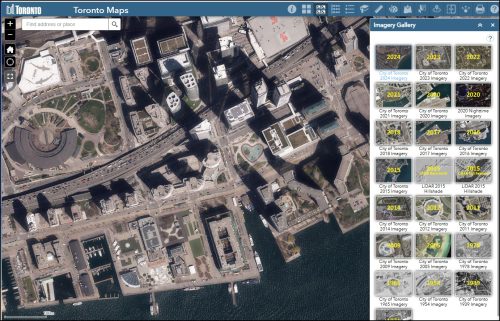
3. ![]() Image Gallery: Toronto Maps can have imagery for its background. Choose between different years of imagery.
Image Gallery: Toronto Maps can have imagery for its background. Choose between different years of imagery.
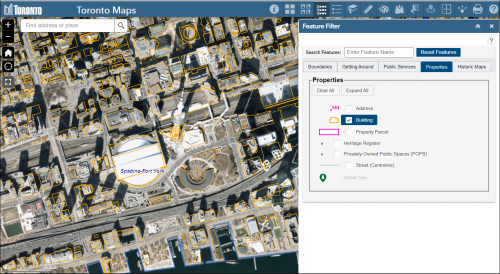
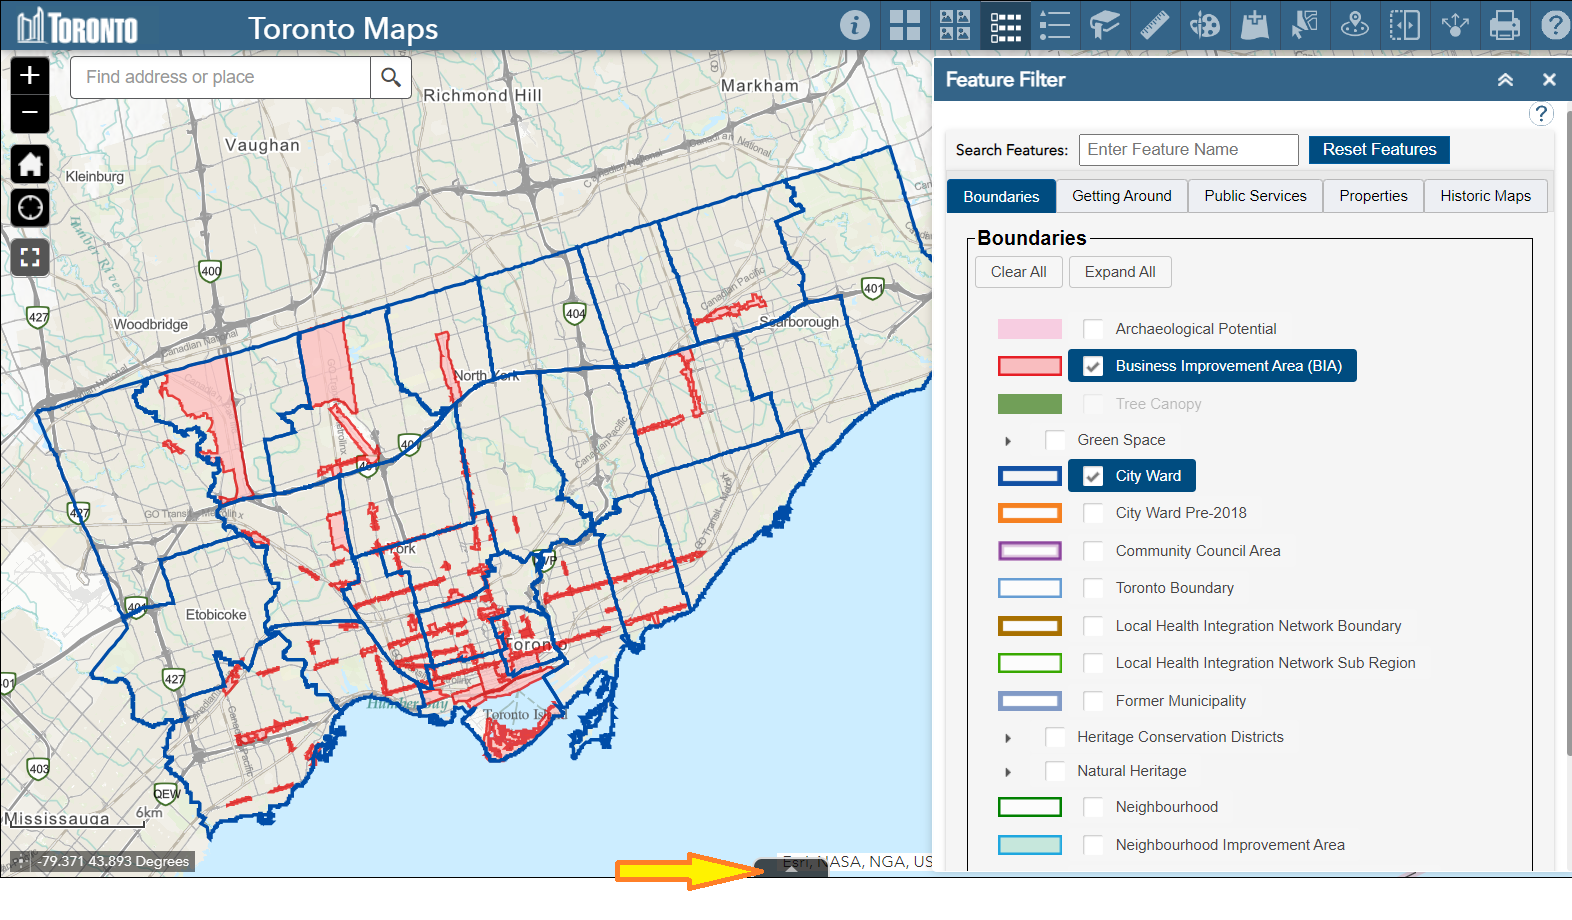
4. ![]() Feature Filter: You may choose to display information on the map from the Feature Filter. You can select one or more features, one or more years of Ortho imagery to display on the map. This tool is selected at start-up.
Feature Filter: You may choose to display information on the map from the Feature Filter. You can select one or more features, one or more years of Ortho imagery to display on the map. This tool is selected at start-up.
5. ![]() Legend: Displays labels and symbols for layers in the map that are selected in the Feature Filter menu.
Legend: Displays labels and symbols for layers in the map that are selected in the Feature Filter menu.
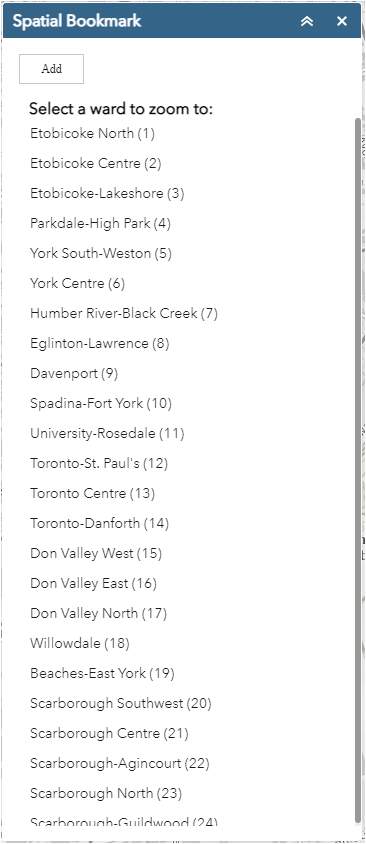
6. ![]() Spatial Bookmark: Zooms to a particular ward or user-defined extent.
Spatial Bookmark: Zooms to a particular ward or user-defined extent.
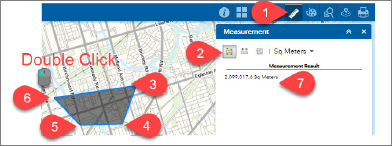
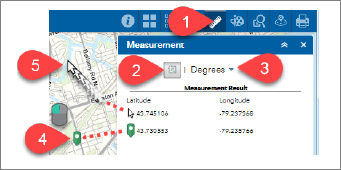
7. ![]() Measurement: Set of measurement tools such as measuring an area, measuring a line, and locating a point.
Measurement: Set of measurement tools such as measuring an area, measuring a line, and locating a point.
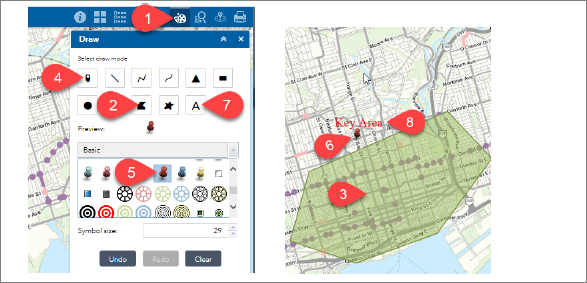
8. ![]() Draw: Allows you to draw lines, shapes, and insert text on your map. You can print your customized map.
Draw: Allows you to draw lines, shapes, and insert text on your map. You can print your customized map.
9. ![]() Add Data: You can add your own data to the map.
Add Data: You can add your own data to the map.
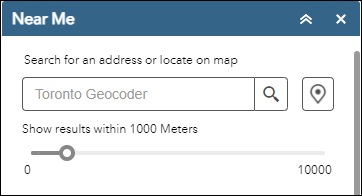
10. ![]() Near Me: Allows you to pin a location on the map and set a buffer around the pin. The tool shows a list of the selected features within the buffer range and provides turn-by-turn directions to the selected feature.
Near Me: Allows you to pin a location on the map and set a buffer around the pin. The tool shows a list of the selected features within the buffer range and provides turn-by-turn directions to the selected feature.
11. ![]() Swipe: You can slide the swipe tool or move the mouse around to reveal the content of another layer.
Swipe: You can slide the swipe tool or move the mouse around to reveal the content of another layer.
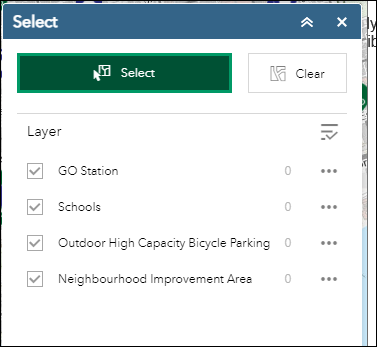
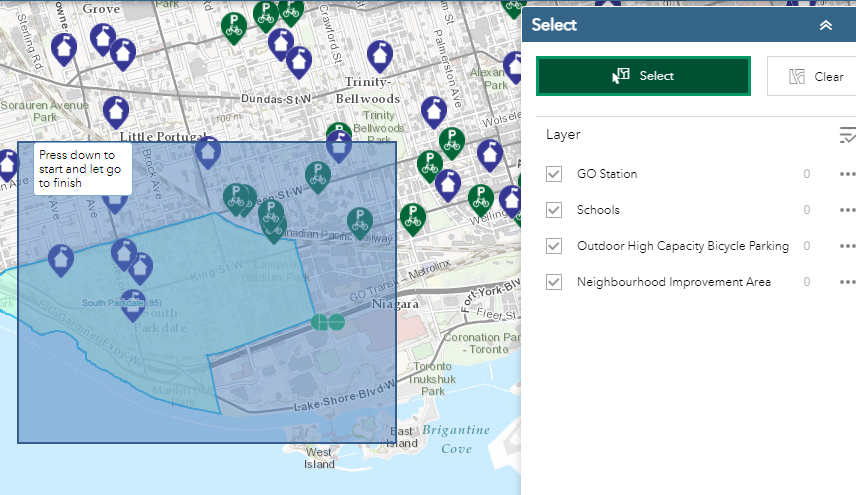
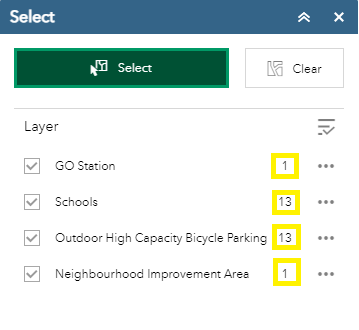
12. ![]() Select: Allows you to select features by selecting by mouse from the map. Selected features can then be compared, exported or printed.
Select: Allows you to select features by selecting by mouse from the map. Selected features can then be compared, exported or printed.
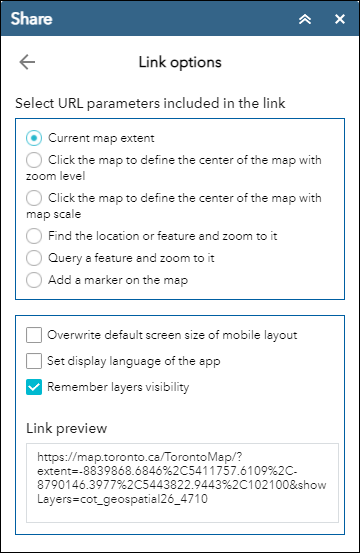
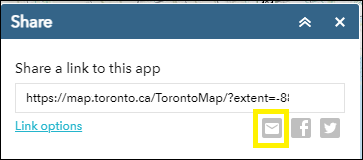
13. ![]() Share: Allows you to share the app by posting it to your social media account or by sending an email with a link.
Share: Allows you to share the app by posting it to your social media account or by sending an email with a link.
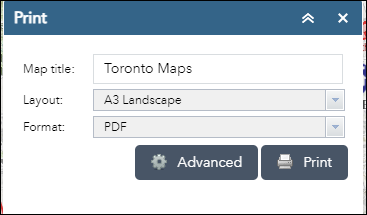
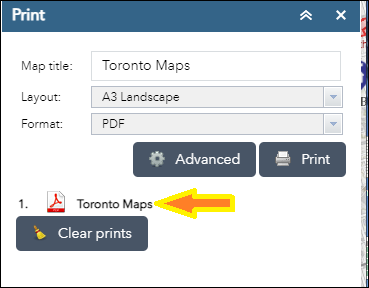
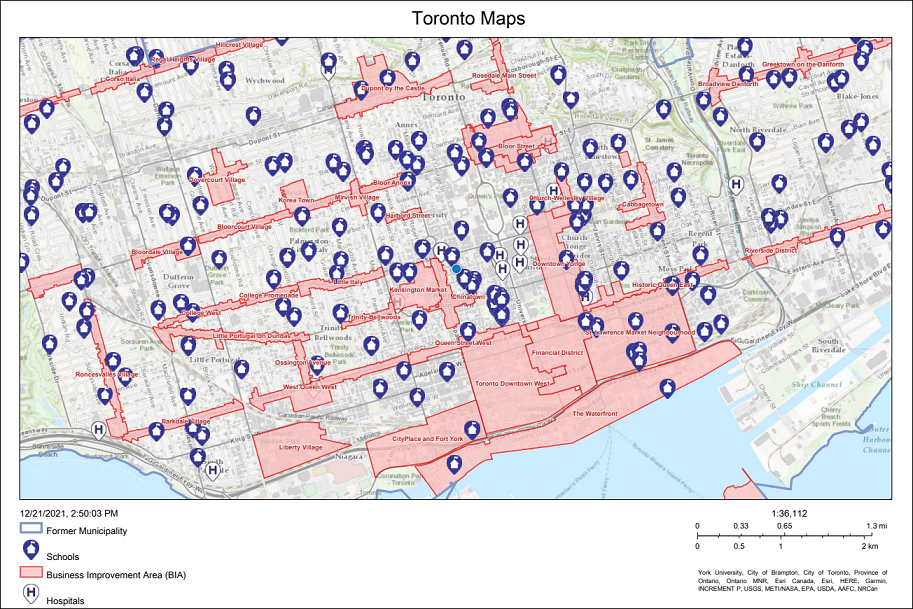
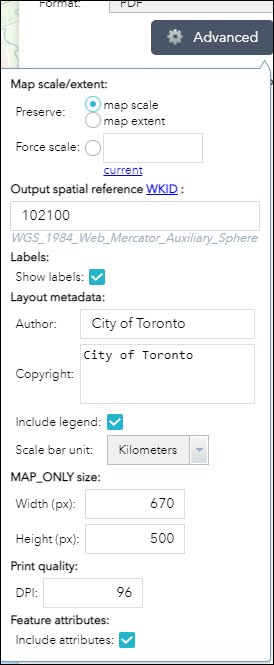
14. ![]() Print: This feature allows you to create printouts choosing from a variety of layouts and formats.
Print: This feature allows you to create printouts choosing from a variety of layouts and formats.
15. ![]() User Guide: opens this help file.
User Guide: opens this help file.
Toronto Maps can have a street map, topography, light or dark grey map for its background. You may choose the background by clicking:
Toronto Maps can have aerial photography for its background. You may choose the background by clicking:
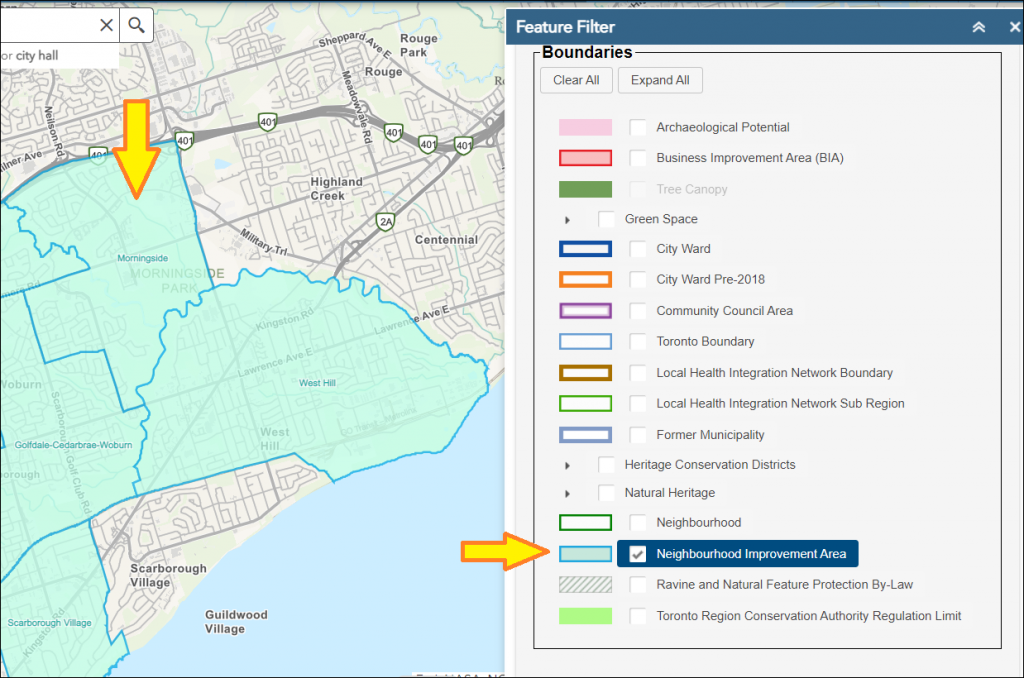
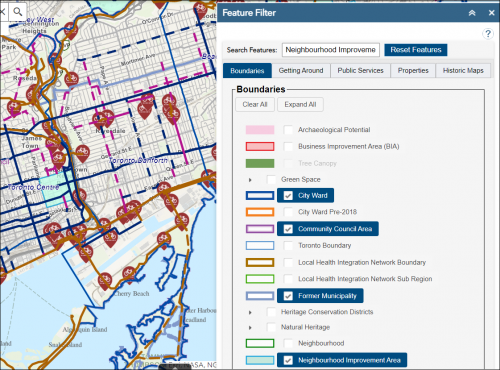
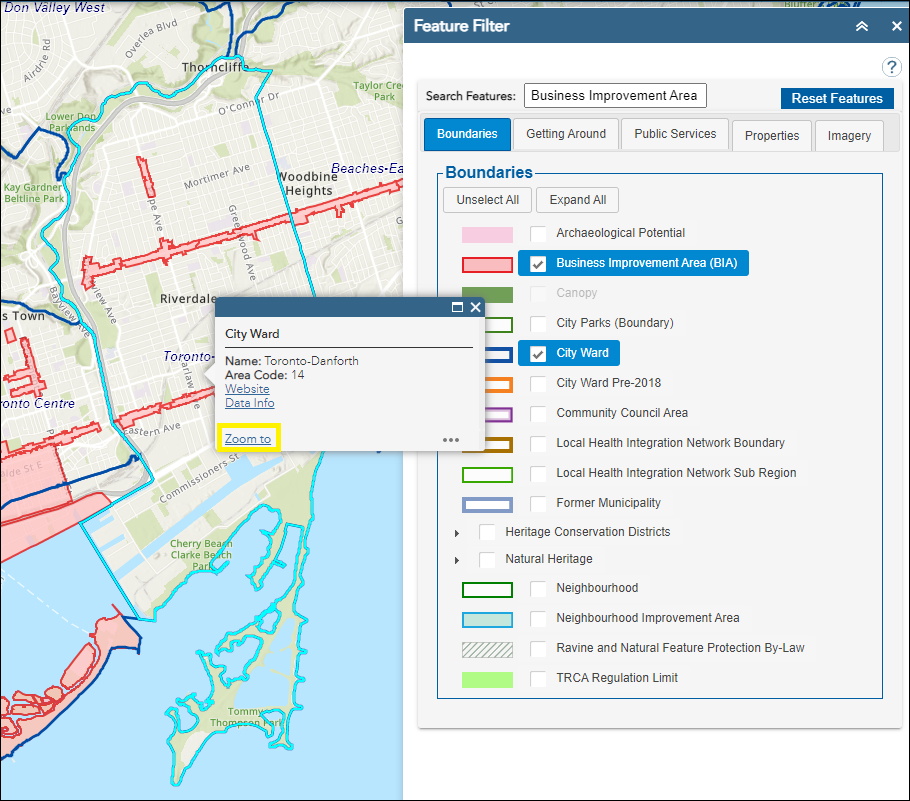
The Feature Filter allows you to check on and off layers on the map. It is also the place where you find the legend with names and symbols for all features. Map Layers are organized according to type and shown in separate tabs.
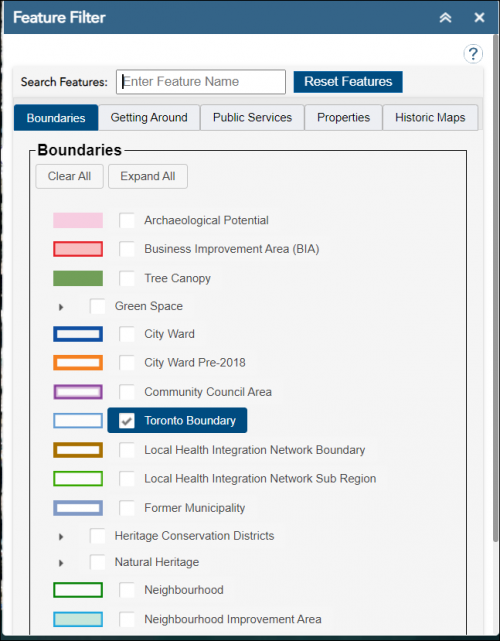
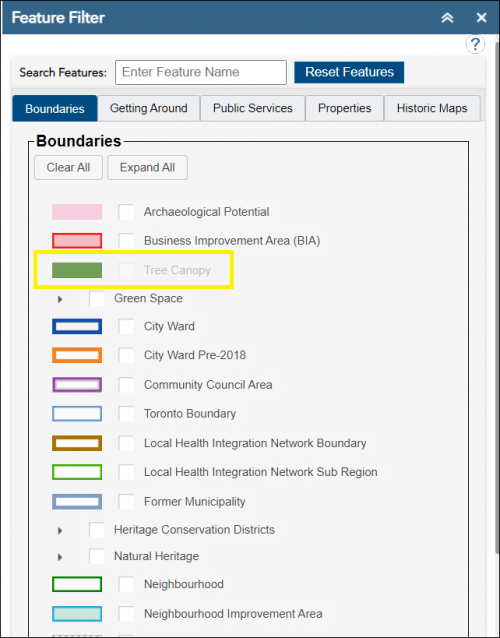
You can also search for layers at the top of the Feature Filter menu.
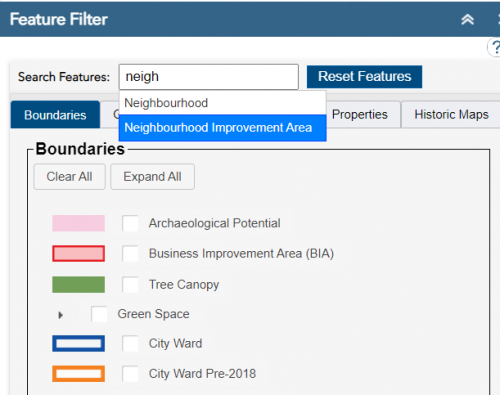
As you type in the search bar, a list of matching layers will be displayed.
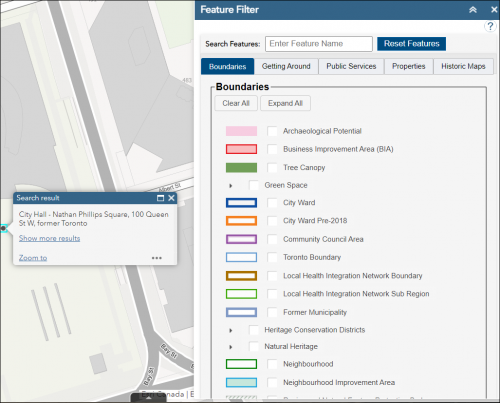
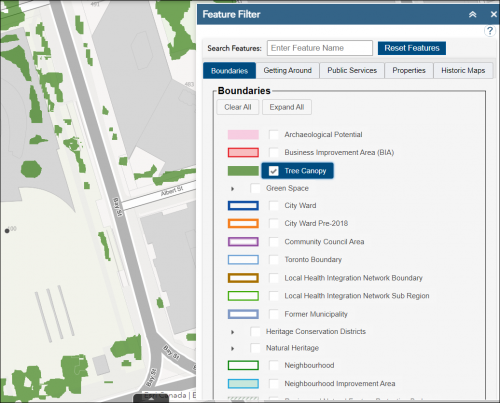
When you select one of the layers from the list that layer will be selected in the Feature Filter menu and drawn on the map.
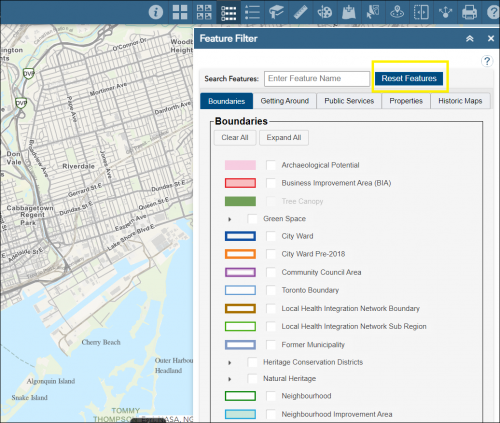
This button clears the selection of all features in all tabs and clears the map display.
Before
After
The Legend tool displays the legend information for all of the layers that have been selected in the Feature Filter tool.
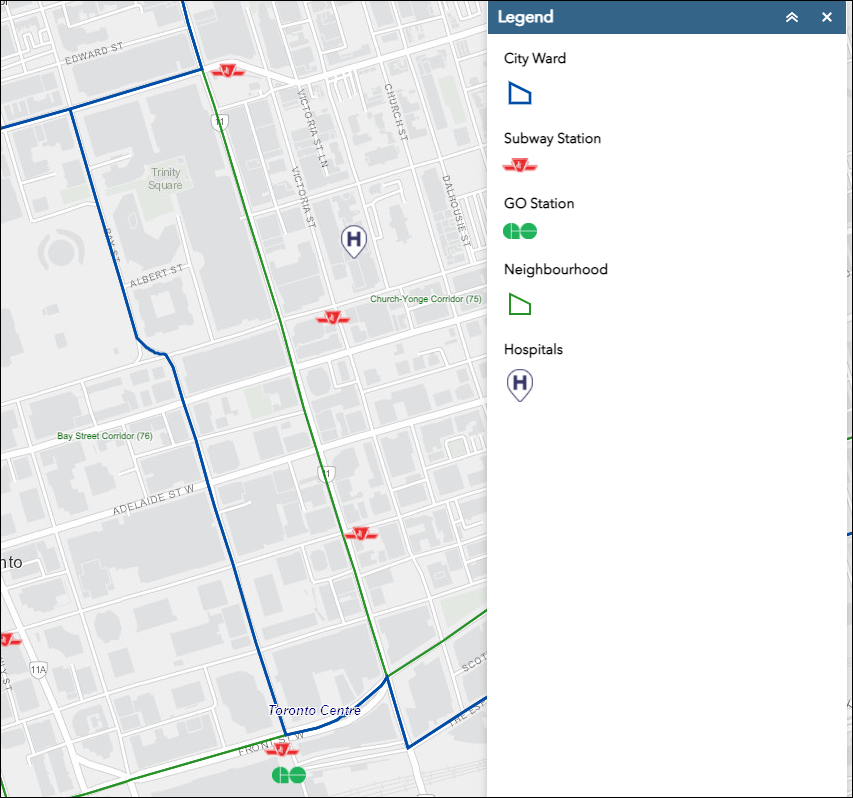
If you have selected to display additional layers using the Feature Filter tool, these additional layers will be displayed in the Legend menu.
Toronto Maps provides default bookmarks for each ward and allows you to create custom ones to save the current map view.
To use a bookmark:
You can also add your customized bookmarks continuing with the following instructions:
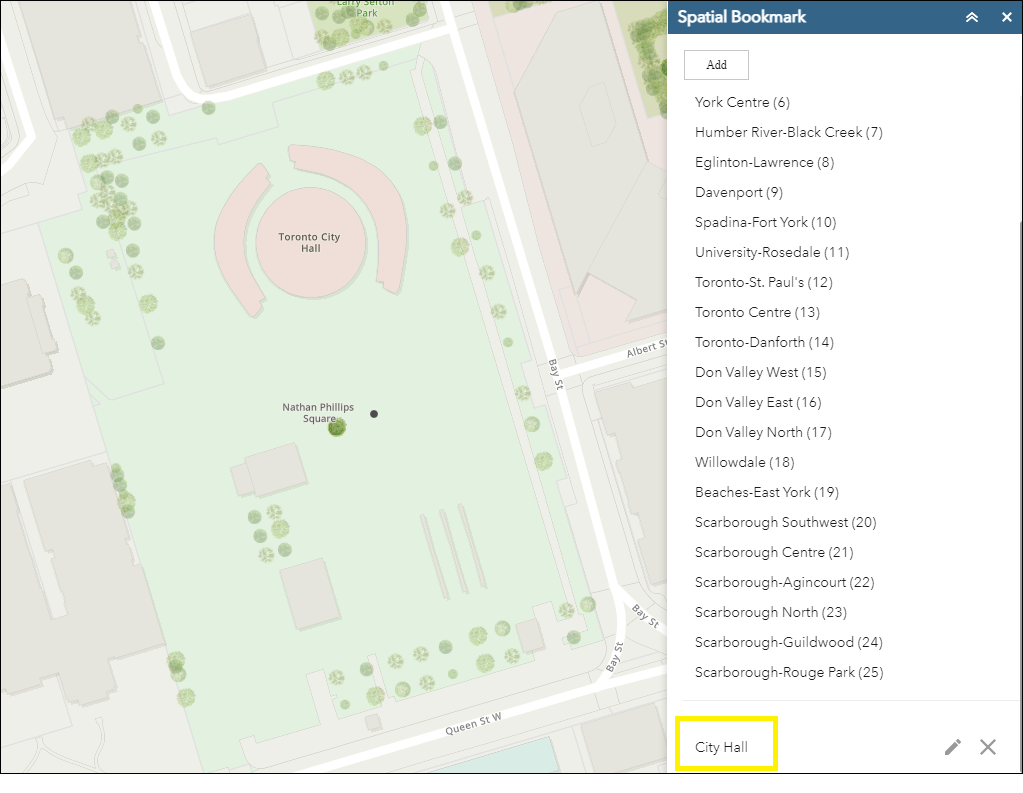
The next time that you open the “Spatial Bookmark” tool, this new bookmark will be available for use.
User will draw a polygon inside the map window and the area of the polygon will be calculated and its result will be shown inside the Measurement panel.
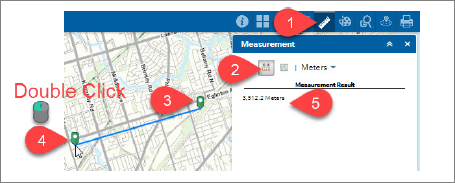
User will draw a line (or polyline) inside the map window and the length of the line will be calculated and its result will be shown inside the Measurement panel.
User will draw a point inside the map window and the x and y of the point will be calculated and its result will be shown inside the Measurement panel.
Personalize your map using Drawing tools like in the picture below. Drawings will be included when you use the print feature, so you can print personalized maps.
The “Add Data” tool enables you to add data to the map by entering map service URLs, or uploading local files. In this way, you can temporarily add layers to and remove layers from the map. The results can be printed, however, you can’t save the layers to the map.
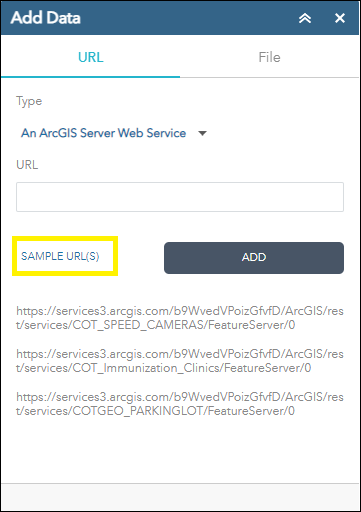
Copy an example URL (i.e. COT_SPEED_CAMERAS)
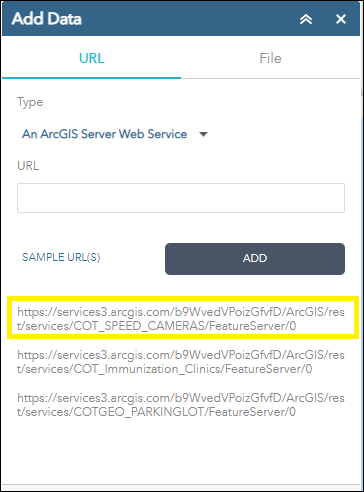
Paste this URL in the URL box.
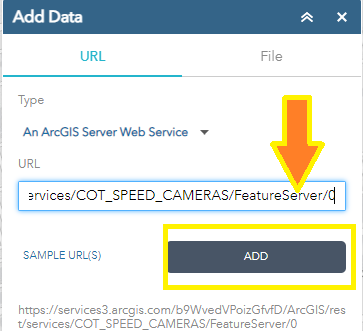
Click the “Add” button
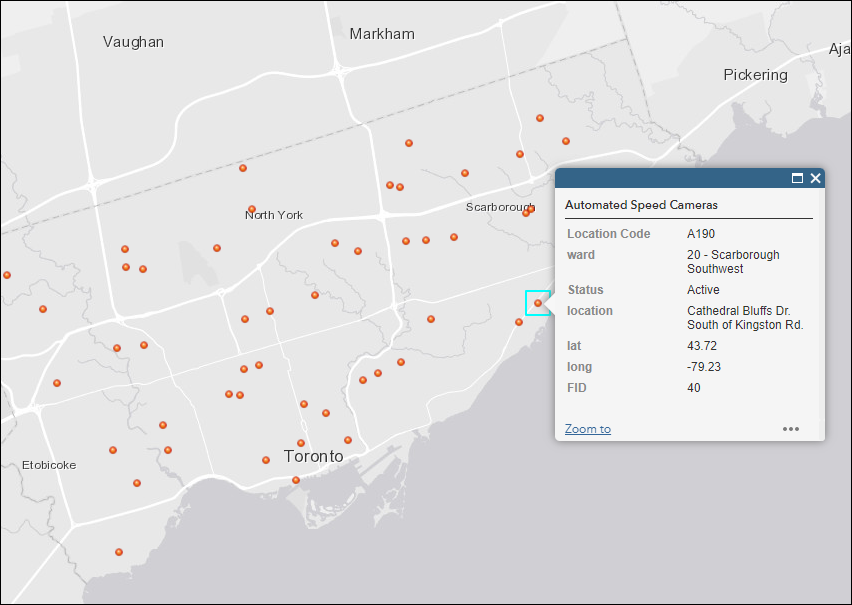
The Automated Speed Cameras are displayed on the map and can be selected to see the details of each location.
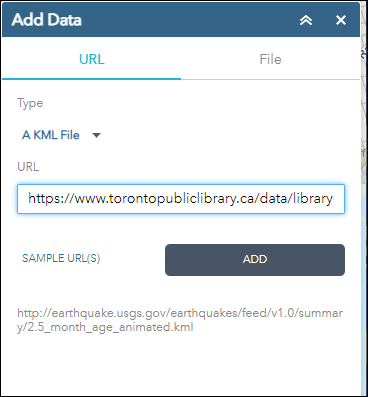
You can also add other types of services – such as kml
Select Type
->A KML File
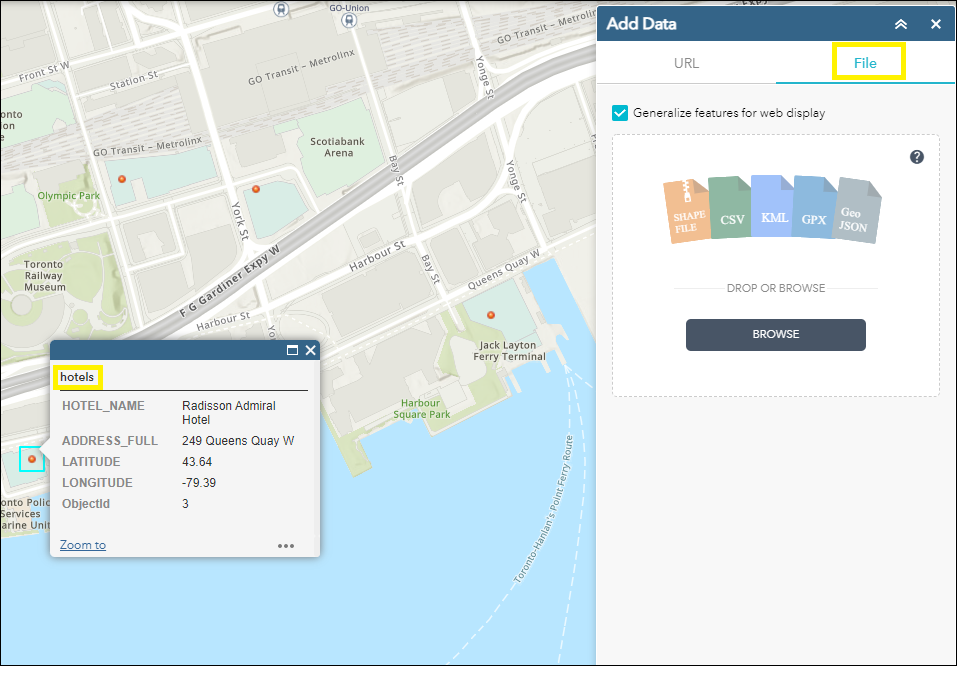
Alternatively, you can Add Data from a file
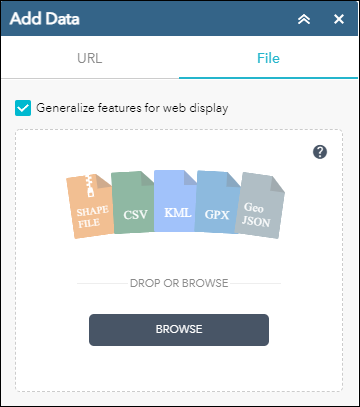
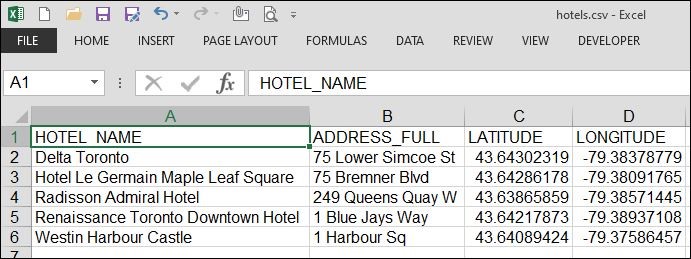
Example of a simple .csv file (hotels.csv)
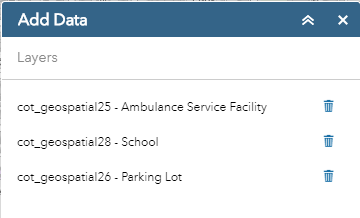
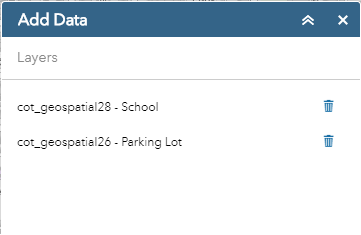
Once layer(s) have been added to the map they can be removed by using the “Layers” menu.
The “Layers” menu displays all layers that have been added to the map
Select the “Remove Layer” icon next to the layer to remove the layer from layer list and from the map display.
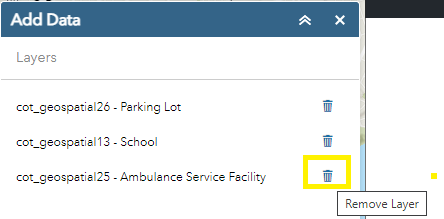
Result (Ambulance Service Facility – no longer visible):
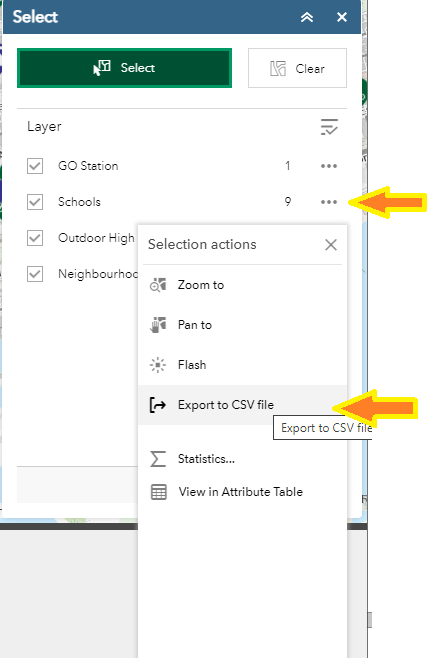
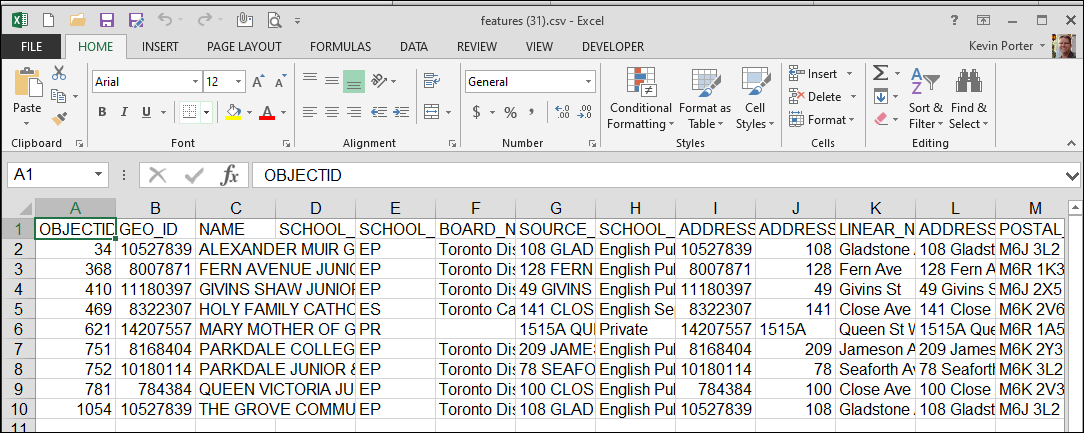
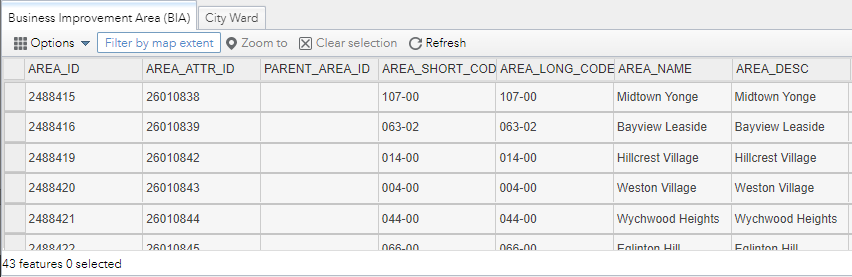
The selected features are exported to the .csv file which can be viewed and edited in Excel.
The Near Me tool allows you to enter a location and create a buffer area around the location. All features that have been selected in the “Feature Filter” that are found within the buffer distance will be listed in the menu (by default the buffer distance is 1000 metres).
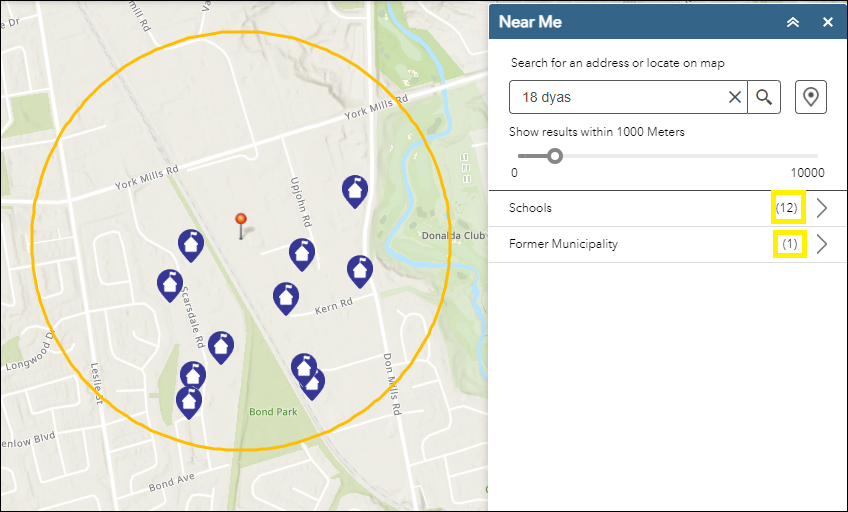 The map centres and zooms to the selected location.A buffered circle will draw on the map and all COVID-19 Resources that fall within this circle (1 km by default) will be listed in the menu.For each category, there is a count of the number of features. (i.e. there are 12 schools within the default buffer distance)
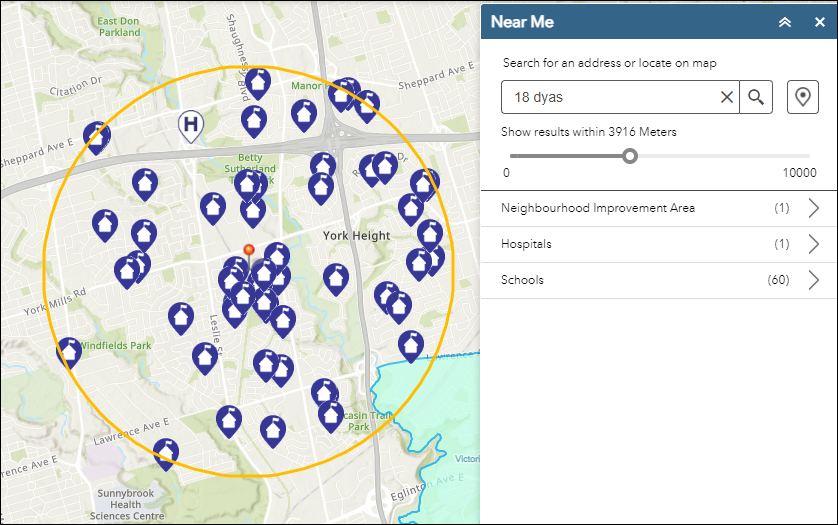
Click on Hospitals and the details of the Hospital(s) that fall within the buffer distance is shown.
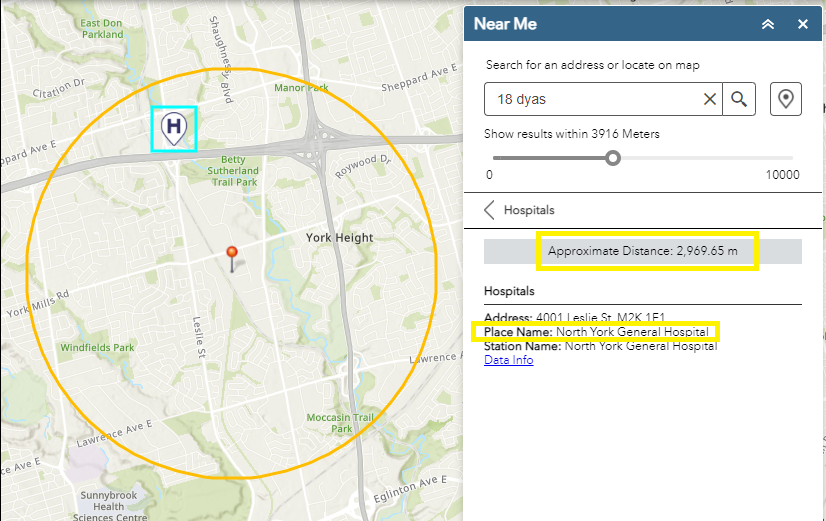
The Name of the closest hospital is shown along with the approximate distance from the address that was entered in the search bar or the pin location that was selected on the map.
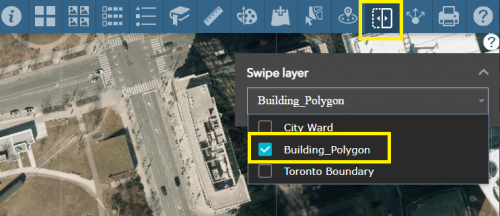
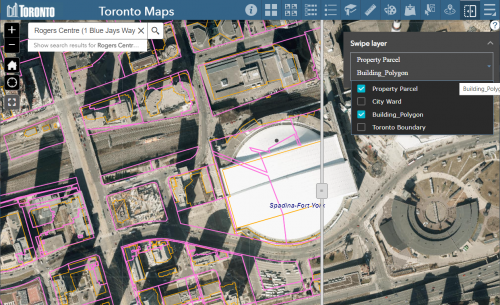
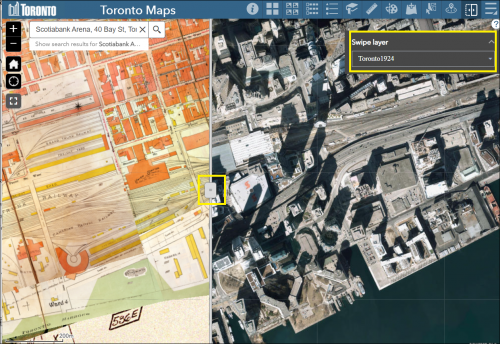
The Swipe Layer tool is used to interactively reveal layers beneath the layer being swiped. This tool makes it easy to see what is underneath a particular layer without having to turn it off in the table of contents.

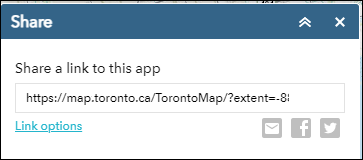
You can share your map via email, Twitter or Facebook.
Print allows you to export the current view of the map in different formats (e.g. PDF, PNG etc.…). The printout will also include all selected features, drawings, a title, and the legend.
To print your map:
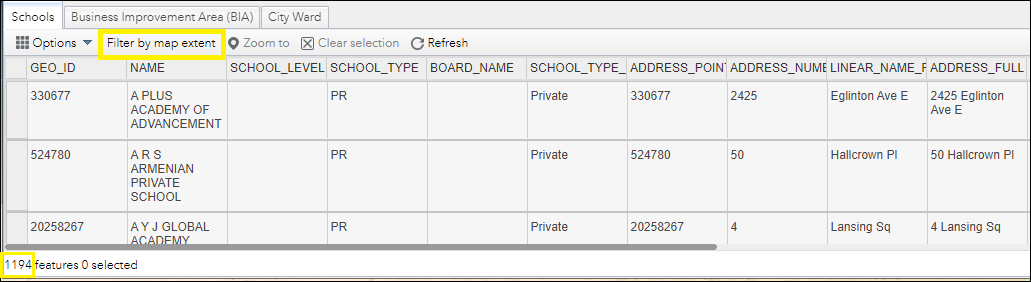
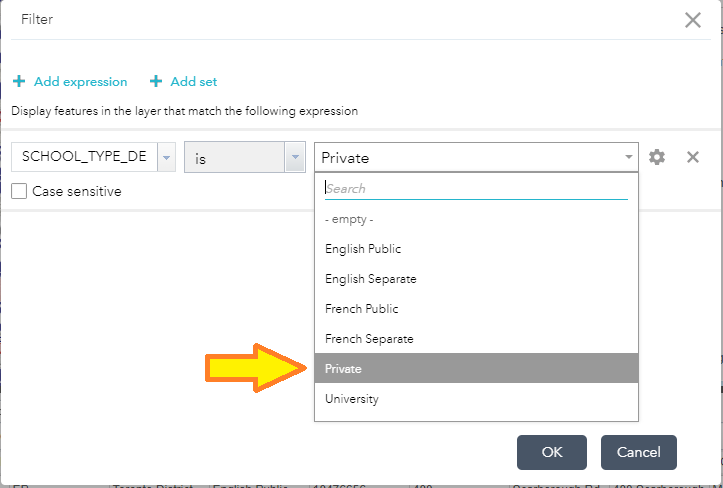
The filter is applied to the attribute table and the map display. 318 of 1194 features where (SCHOOL_TYPE_DESC = Private) are displayed.
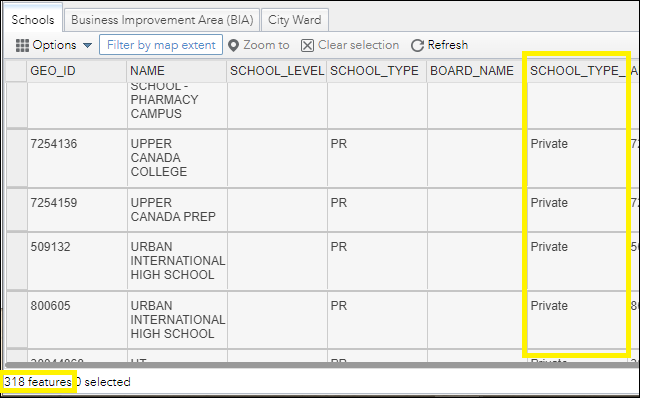
Only the Private schools are now displayed on the map.
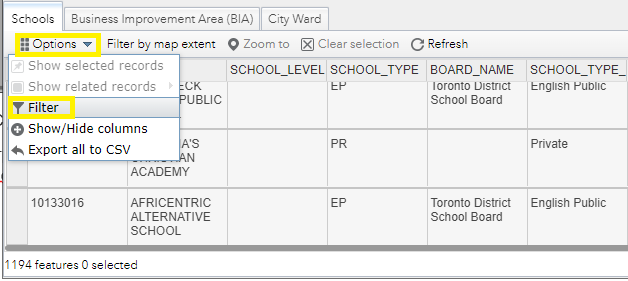
Optionally, you can click Options and Show/Hide Columns to limit the columns of information shown in the attribute table.
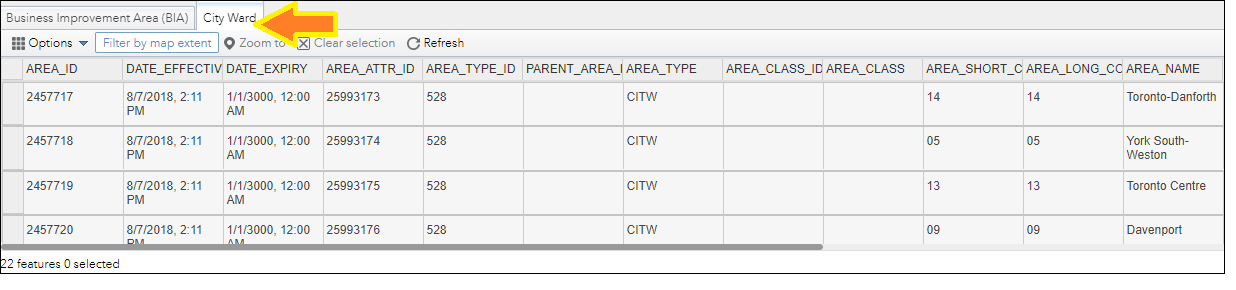
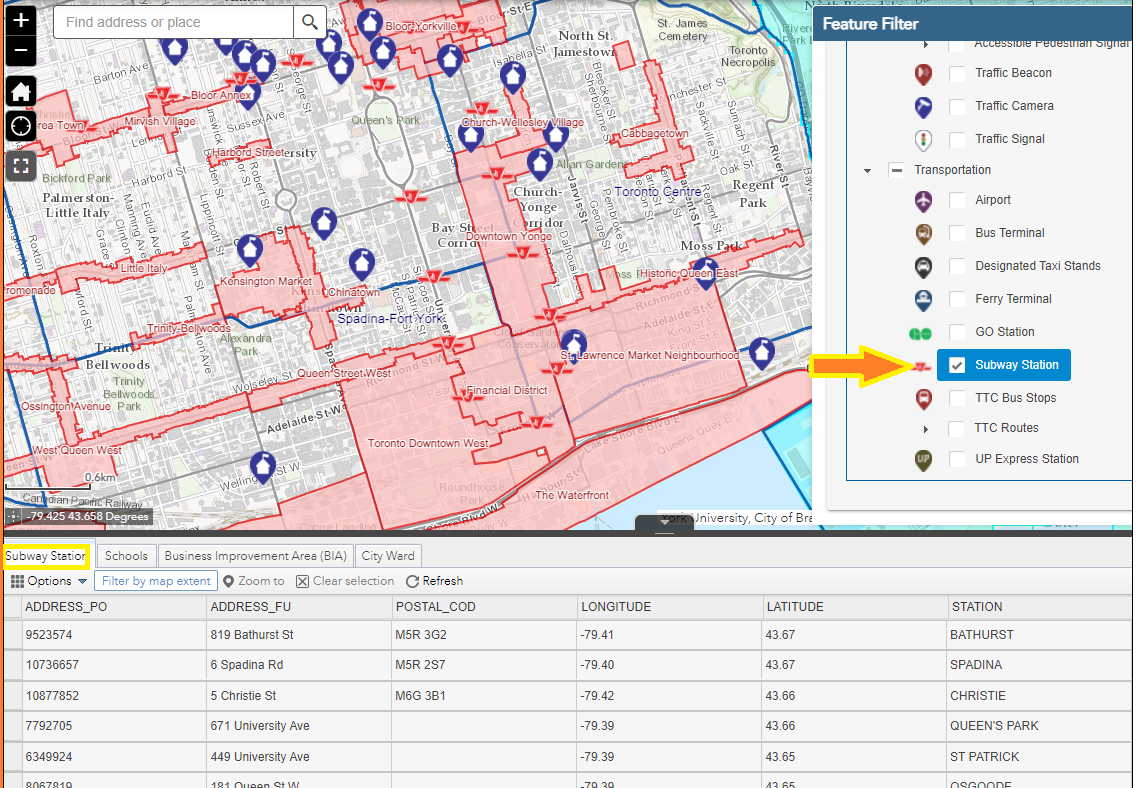
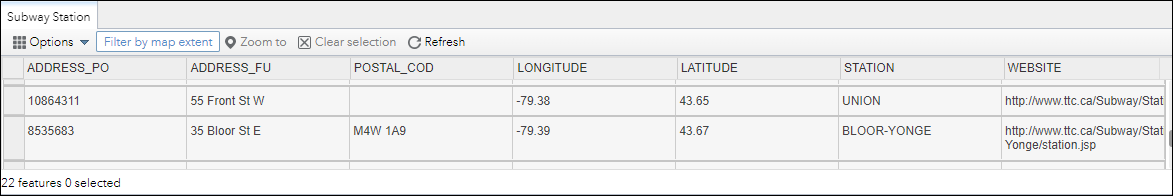
When you add an additional layer to the map using the Feature Filter tool they will be displayed in the attribute table showing an additional tab (i.e. Subway Station)
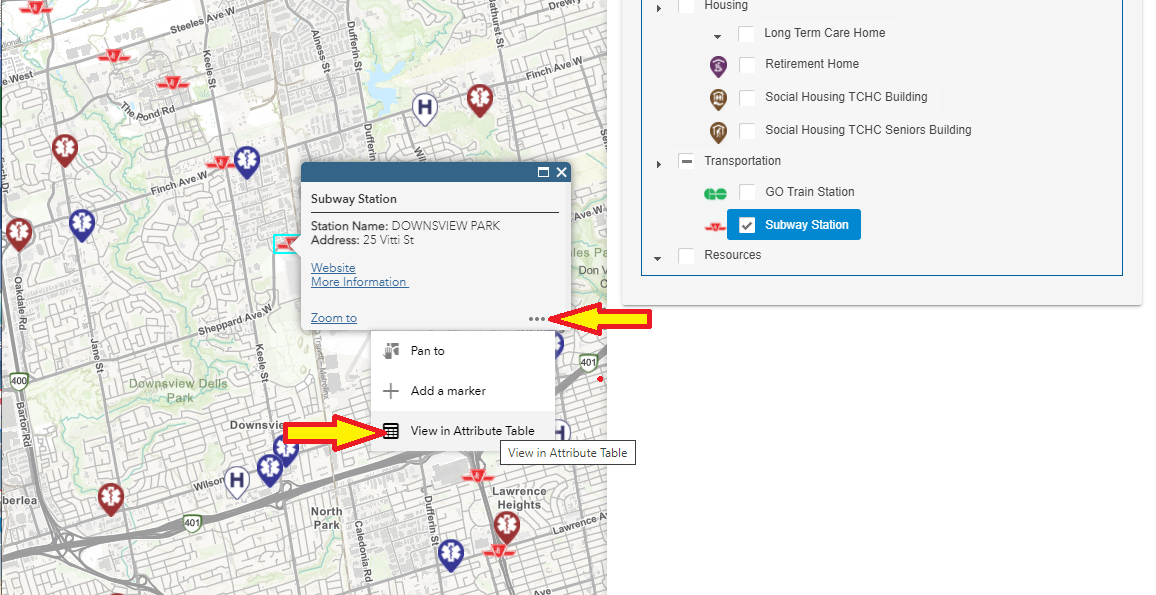
Alternatively, you can display a layer’s attributes by selecting the ellipses “…” button and View in Attribute Table from the popup menu for each layer.
Version 3.3.0
December 12, 2024
Version 3.2.0
June 21, 2024
Version 3.1.0
August 18, 2023
Version 3.0
April 2023
New version of Toronto Maps (v3.0) with updated functionality, additional data layers and improved mobile capabilities.