Toronto’s 158 social planning neighbourhoods are a microcosm of the city’s inhabitants, cultures and life. The primary purpose of the City-designated social planning neighbourhoods is to help City staff collect data, plan, analyze and forecast City services. While these neighbourhoods may not fully encompass every historical, cultural, ethnic or economic neighbourhood area, they do provide a way for planners and researchers to track information about them over time.
Unlike other geographies like wards or dissemination blocks, the boundaries of these neighbourhoods change very infrequently over time, allowing researchers to perform longitudinal studies to see the changes in each area. Not all people define neighbourhoods the same way, but for the purposes of statistical reporting these neighbourhoods were defined based on Statistics Canada census tracts.
Toronto’s neighbourhoods numbered 140 from the late 1990s to March 2022, when some neighbourhoods were split because of very high population growth. There are now 158 neighbourhoods and the split neighbourhoods are shown on the map and table below:
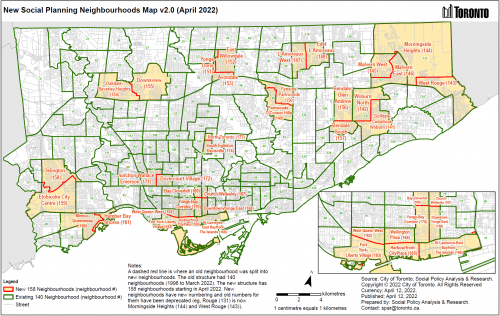
To accommodate density growth in 16 of the City’s social planning neighbourhoods, an administrative update is taking effect resulting in a shift from 140 social planning neighbourhoods in Toronto to 158. The social planning neighbourhoods are data sets used by City divisions and agencies, community organizations, institutions and researchers to address social development and planning needs.
Since statistical analysis is more accurate when units of geography and population are more equal or comparable in size and number, 16 high growth neighbourhoods were split into 34 new ones (with the old ones retired).
In the 1990s, at an administrative level, City of Toronto staff developed the social planning neighbourhoods as operational boundaries to collect data and improve planning and analysis. The social planning neighbourhoods were created in order to make it easier for the City to collect data on neighbourhoods to address social development and planning needs. For example, they enable the City to collect standard, comparable, reliable poverty statistics from Statistics Canada over many years to implement poverty reduction programs. They are largely used to report demographic information for research and social services planning.
The existing neighbourhoods have been unchanged for 25 years. The decision to split 16 neighbourhoods was made after the 2016 Census data revealed new neighbourhood population numbers.
Differential population growth over the last 20 years has seen large population increases in parts of the city while other neighbourhoods saw no growth. This has resulted in population discrepancies that make it harder to support effective planning. Statistical analysis is more accurate when units of geography and population are more equal or comparable in size and number.
The Social Development, Finance and Administration (SDFA) division of the City of Toronto, working with multiple divisions, have worked to update the social planning neighbourhoods to enable effective research and planning now and in the future.
Sixteen neighbourhoods were split into 34 new ones (with the old ones retired), for a grand total of 158 social planning neighbourhoods in Toronto, from 140 previously. 124 of the original social planning neighbourhoods will remain the same. Only 16 old social planning neighbourhoods will change and be replaced with 34 new ones; the rest remain the same.
Neighbourhood names were created by taking historical information, prominent features, landmarks, or institutions, colloquial names and other socio-cultural information into account, then shortened into a reasonable compound name that can be easily referenced.
Name changes were made in consultation with stakeholders from City Planning, Canada Mortgage and Housing Corporation, Toronto Police Service, Economic Development and Culture, Toronto Real Estate Board, and the Ontario Community Health Profiles Partnership in the 2017 to 2019 timeframe, as well as citizen and councillor input in 2021.
The names of neighbourhoods are established for research and analysis purposes and are not the final word on the cultural, historical or colloquial names of Toronto’s neighbourhoods. There are more than 400 historical neighbourhoods and communities in Toronto and most are not their own social planning neighbourhoods.
Not all historical names can be included in the 158 social planning neighbourhoods because it is impossible to do so without altering the boundaries of census tracts from Statistics Canada, which the City cannot do.
When neighbourhoods do not have roughly equal populations, phenomena being studied (such as poverty) can be “hidden” within the larger population of a neighbourhood. The previous 140 neighbourhoods revealed some neighbourhoods with up to nine times the population of others. This makes it difficult to detect phenomena of interest to the City, to compare neighbourhoods across indicators. Having neighbourhoods with more balanced and similar populations allows for more equitable analysis.
This update to the social planning neighbourhoods will have little to no impact on the everyday lives of residents. However, because the social planning neighbourhoods support service planning and research, having an updated set of neighbourhoods allows service planners to be able to detect more accurately, phenomena like poverty, and to make more effective decisions about service provision.
The cultural and historical aspects of Toronto’s neighbourhoods are addressed in other forms, such as the Wayfinding Study done by Transportation Services and the historical maps available through City Archives. The social planning neighbourhoods are not a replacement for these maps and boundaries, and they serve an entirely different purpose and service.
Neighbourhoods which were updated/split in 2022 have received new names and new numbers starting at #141 to avoid confusion among City divisions and community partners about whether any given map, analysis, database, report or dataset was referring to an old neighbourhood or new neighbourhood with the same name or number. Reusing old names and numbers for new boundaries may also introduce erroneous linkages to old or new data within complex planning systems.
The outer boundaries of neighbourhoods that were split remain the same, while internal lines following census tracts were added to distinguish the new neighbourhoods. This approach allows for the previous neighbourhoods to be compared to new neighbourhoods. In the neighbourhoods in which splits occurred, the split lines also follow Statistic Canada’s census tract lines from the 2016 Census. Total population is the primary variable that determined the neighbourhood splits. Natural features such as parks and rivers are taken into account when forming splits, as these are already included in census tracts.
Two neighbourhoods with NIA designations have been split:
A split of an NIA will not impact service to either neighbourhood. Both new neighbourhoods will remain NIAs.
Neighbourhood profiles and datasets for the new neighbourhoods will become available when data from the 2021 Census is released in 2022. Statistics Canada will be releasing data from the 2021 Census of population according to their Census Release Schedule. New neighbourhood data will be added to the neighbourhood profiles in the months following each release. Complete 2016 Census data by 158 neighbourhoods will be available in April 2022.
The 140 neighbourhoods should be sourced as: Toronto Social Planning Neighbourhoods v2.0, City of Toronto 1996-2022.
The 158 neighbourhoods should be sourced as: Toronto Social Planning Neighbourhoods v3.0, City of Toronto 2022.
To find a neighbourhood using a map or an address, go to the Find Your Neighbourhood webpage. A textual description of each neighbourhood boundary can also be found on the Find Your Neighbourhood webpage.
| Neighbourhood | Neighbourhood # | Neighbourhood Designation |
|---|---|---|
| West Humber-Clairville | 1 | Not an NIA or Emerging Neighbourhood |
| Mount Olive-Silverstone-Jamestown | 2 | Neighbourhood Improvement Area |
| Thistletown-Beaumond Heights | 3 | Neighbourhood Improvement Area |
| Rexdale-Kipling | 4 | Not an NIA or Emerging Neighbourhood |
| Elms-Old Rexdale | 5 | Neighbourhood Improvement Area |
| Kingsview Village-The Westway | 6 | Neighbourhood Improvement Area |
| Willowridge-Martingrove-Richview | 7 | Not an NIA or Emerging Neighbourhood |
| Humber Heights-Westmount | 8 | Emerging Neighbourhood |
| Edenbridge-Humber Valley | 9 | Not an NIA or Emerging Neighbourhood |
| Princess-Rosethorn | 10 | Not an NIA or Emerging Neighbourhood |
| Eringate-Centennial-West Deane | 11 | Not an NIA or Emerging Neighbourhood |
| Markland Wood | 12 | Not an NIA or Emerging Neighbourhood |
| Etobicoke West Mall | 13 | Not an NIA or Emerging Neighbourhood |
| Kingsway South | 15 | Not an NIA or Emerging Neighbourhood |
| Stonegate-Queensway | 16 | Not an NIA or Emerging Neighbourhood |
| New Toronto | 18 | Not an NIA or Emerging Neighbourhood |
| Long Branch | 19 | Not an NIA or Emerging Neighbourhood |
| Alderwood | 20 | Not an NIA or Emerging Neighbourhood |
| Humber Summit | 21 | Neighbourhood Improvement Area |
| Humbermede | 22 | Neighbourhood Improvement Area |
| Pelmo Park-Humberlea | 23 | Not an NIA or Emerging Neighbourhood |
| Black Creek | 24 | Neighbourhood Improvement Area |
| Glenfield-Jane Heights | 25 | Neighbourhood Improvement Area |
| York University Heights | 27 | Neighbourhood Improvement Area |
| Rustic | 28 | Neighbourhood Improvement Area |
| Maple Leaf | 29 | Not an NIA or Emerging Neighbourhood |
| Brookhaven-Amesbury | 30 | Not an NIA or Emerging Neighbourhood |
| Yorkdale-Glen Park | 31 | Emerging Neighbourhood |
| Englemount-Lawrence | 32 | Emerging Neighbourhood |
| Clanton Park | 33 | Not an NIA or Emerging Neighbourhood |
| Bathurst Manor | 34 | Not an NIA or Emerging Neighbourhood |
| Westminster-Branson | 35 | Emerging Neighbourhood |
| Newtonbrook West | 36 | Not an NIA or Emerging Neighbourhood |
| Willowdale West | 37 | Not an NIA or Emerging Neighbourhood |
| Lansing-Westgate | 38 | Not an NIA or Emerging Neighbourhood |
| Bedford Park-Nortown | 39 | Not an NIA or Emerging Neighbourhood |
| St.Andrew-Windfields | 40 | Not an NIA or Emerging Neighbourhood |
| Bridle Path-Sunnybrook-York Mills | 41 | Not an NIA or Emerging Neighbourhood |
| Banbury-Don Mills | 42 | Not an NIA or Emerging Neighbourhood |
| Victoria Village | 43 | Neighbourhood Improvement Area |
| Flemingdon Park | 44 | Neighbourhood Improvement Area |
| Pleasant View | 46 | Not an NIA or Emerging Neighbourhood |
| Don Valley Village | 47 | Not an NIA or Emerging Neighbourhood |
| Hillcrest Village | 48 | Not an NIA or Emerging Neighbourhood |
| Bayview Woods-Steeles | 49 | Not an NIA or Emerging Neighbourhood |
| Newtonbrook East | 50 | Not an NIA or Emerging Neighbourhood |
| Bayview Village | 52 | Not an NIA or Emerging Neighbourhood |
| Henry Farm | 53 | Not an NIA or Emerging Neighbourhood |
| O`Connor Parkview | 54 | Not an NIA or Emerging Neighbourhood |
| Thorncliffe Park | 55 | Neighbourhood Improvement Area |
| Leaside-Bennington | 56 | Not an NIA or Emerging Neighbourhood |
| Broadview North | 57 | Not an NIA or Emerging Neighbourhood |
| Old East York | 58 | Not an NIA or Emerging Neighbourhood |
| Danforth-East York | 59 | Not an NIA or Emerging Neighbourhood |
| Woodbine-Lumsden | 60 | Not an NIA or Emerging Neighbourhood |
| Taylor Massey | 61 | Neighbourhood Improvement Area |
| East End Danforth | 62 | Not an NIA or Emerging Neighbourhood |
| The Beaches | 63 | Not an NIA or Emerging Neighbourhood |
| Woodbine Corridor | 64 | Not an NIA or Emerging Neighbourhood |
| Greenwood-Coxwell | 65 | Not an NIA or Emerging Neighbourhood |
| Danforth | 66 | Not an NIA or Emerging Neighbourhood |
| Playter Estates-Danforth | 67 | Not an NIA or Emerging Neighbourhood |
| North Riverdale | 68 | Not an NIA or Emerging Neighbourhood |
| Blake-Jones | 69 | Not an NIA or Emerging Neighbourhood |
| South Riverdale | 70 | Not an NIA or Emerging Neighbourhood |
| Cabbagetown-South St. James Town | 71 | Not an NIA or Emerging Neighbourhood |
| Regent Park | 72 | Neighbourhood Improvement Area |
| Moss Park | 73 | Not an NIA or Emerging Neighbourhood |
| North St. James Town | 74 | Not an NIA or Emerging Neighbourhood |
| Kensington-Chinatown | 78 | Not an NIA or Emerging Neighbourhood |
| University | 79 | Not an NIA or Emerging Neighbourhood |
| Palmerston-Little Italy | 80 | Not an NIA or Emerging Neighbourhood |
| Trinity-Bellwoods | 81 | Not an NIA or Emerging Neighbourhood |
| Dufferin Grove | 83 | Not an NIA or Emerging Neighbourhood |
| Little Portugal | 84 | Not an NIA or Emerging Neighbourhood |
| South Parkdale | 85 | Neighbourhood Improvement Area |
| Roncesvalles | 86 | Not an NIA or Emerging Neighbourhood |
| High Park-Swansea | 87 | Not an NIA or Emerging Neighbourhood |
| High Park North | 88 | Not an NIA or Emerging Neighbourhood |
| Runnymede-Bloor West Village | 89 | Not an NIA or Emerging Neighbourhood |
| Junction Area | 90 | Not an NIA or Emerging Neighbourhood |
| Weston-Pelham Park | 91 | Neighbourhood Improvement Area |
| Corso Italia-Davenport | 92 | Not an NIA or Emerging Neighbourhood |
| Wychwood | 94 | Not an NIA or Emerging Neighbourhood |
| Annex | 95 | Not an NIA or Emerging Neighbourhood |
| Casa Loma | 96 | Not an NIA or Emerging Neighbourhood |
| Yonge-St. Clair | 97 | Not an NIA or Emerging Neighbourhood |
| Rosedale-Moore Park | 98 | Not an NIA or Emerging Neighbourhood |
| Mount Pleasant East | 99 | Not an NIA or Emerging Neighbourhood |
| Yonge-Eglinton | 100 | Not an NIA or Emerging Neighbourhood |
| Forest Hill South | 101 | Not an NIA or Emerging Neighbourhood |
| Forest Hill North | 102 | Not an NIA or Emerging Neighbourhood |
| Lawrence Park South | 103 | Not an NIA or Emerging Neighbourhood |
| Lawrence Park North | 105 | Not an NIA or Emerging Neighbourhood |
| Humewood-Cedarvale | 106 | Not an NIA or Emerging Neighbourhood |
| Oakwood Village | 107 | Not an NIA or Emerging Neighbourhood |
| Briar Hill-Belgravia | 108 | Not an NIA or Emerging Neighbourhood |
| Caledonia-Fairbank | 109 | Not an NIA or Emerging Neighbourhood |
| Keelesdale-Eglinton West | 110 | Neighbourhood Improvement Area |
| Rockcliffe-Smythe | 111 | Neighbourhood Improvement Area |
| Beechborough-Greenbrook | 112 | Neighbourhood Improvement Area |
| Weston | 113 | Neighbourhood Improvement Area |
| Lambton Baby Point | 114 | Not an NIA or Emerging Neighbourhood |
| Mount Dennis | 115 | Neighbourhood Improvement Area |
| Steeles | 116 | Emerging Neighbourhood |
| Tam O'Shanter-Sullivan | 118 | Not an NIA or Emerging Neighbourhood |
| Wexford/Maryvale | 119 | Not an NIA or Emerging Neighbourhood |
| Clairlea-Birchmount | 120 | Not an NIA or Emerging Neighbourhood |
| Oakridge | 121 | Neighbourhood Improvement Area |
| Birchcliffe-Cliffside | 122 | Not an NIA or Emerging Neighbourhood |
| Cliffcrest | 123 | Not an NIA or Emerging Neighbourhood |
| Kennedy Park | 124 | Neighbourhood Improvement Area |
| Ionview | 125 | Neighbourhood Improvement Area |
| Dorset Park | 126 | Emerging Neighbourhood |
| Agincourt South-Malvern West | 128 | Not an NIA or Emerging Neighbourhood |
| Agincourt North | 129 | Not an NIA or Emerging Neighbourhood |
| Milliken | 130 | Not an NIA or Emerging Neighbourhood |
| Centennial Scarborough | 133 | Not an NIA or Emerging Neighbourhood |
| Highland Creek | 134 | Not an NIA or Emerging Neighbourhood |
| Morningside | 135 | Neighbourhood Improvement Area |
| West Hill | 136 | Neighbourhood Improvement Area |
| Eglinton East | 138 | Neighbourhood Improvement Area |
| Scarborough Village | 139 | Neighbourhood Improvement Area |
| Guildwood | 140 | Not an NIA or Emerging Neighbourhood |
| Golfdale-Cedarbrae-Woburn | 141 | Neighbourhood Improvement Area (formerly Woburn) |
| Woburn North | 142 | Neighbourhood Improvement Area (formerly Woburn) |
| West Rouge | 143 | Not an NIA or Emerging Neighbourhood |
| Morningside Heights | 144 | Not an NIA or Emerging Neighbourhood |
| Malvern West | 145 | Emerging Neighbourhood |
| Malvern East | 146 | Emerging Neighbourhood |
| L'Amoreaux West | 147 | Emerging Neighbourhood |
| East L'Amoreaux | 148 | Emerging Neighbourhood |
| Parkwoods-O'Connor Hills | 149 | Not an NIA or Emerging Neighbourhood |
| Fenside-Parkwoods | 150 | Not an NIA or Emerging Neighbourhood |
| Yonge-Doris | 151 | Not an NIA or Emerging Neighbourhood |
| East Willowdale | 152 | Not an NIA or Emerging Neighbourhood |
| Avondale | 153 | Not an NIA or Emerging Neighbourhood |
| Oakdale-Beverley Heights | 154 | Neighbourhood Improvement Area (formerly Downsview-Roding-CFB) |
| Downsview | 155 | Neighbourhood Improvement Area (formerly Downsview-Roding-CFB) |
| Bendale-Glen Andrew | 156 | Not an NIA or Emerging Neighbourhood |
| Bendale South | 157 | Not an NIA or Emerging Neighbourhood |
| Islington | 158 | Not an NIA or Emerging Neighbourhood |
| Etobicoke City Centre | 159 | Not an NIA or Emerging Neighbourhood |
| Mimico-Queensway | 160 | Not an NIA or Emerging Neighbourhood |
| Humber Bay Shores | 161 | Not an NIA or Emerging Neighbourhood |
| West Queen West | 162 | Not an NIA or Emerging Neighbourhood |
| Fort York-Liberty Village | 163 | Not an NIA or Emerging Neighbourhood |
| Wellington Place | 164 | Not an NIA or Emerging Neighbourhood |
| Harbourfront-CityPlace | 165 | Not an NIA or Emerging Neighbourhood |
| St Lawrence-East Bayfront-The Islands | 166 | Not an NIA or Emerging Neighbourhood |
| Church-Wellesley | 167 | Not an NIA or Emerging Neighbourhood |
| Downtown Yonge East | 168 | Not an NIA or Emerging Neighbourhood |
| Bay-Cloverhill | 169 | Not an NIA or Emerging Neighbourhood |
| Yonge-Bay Corridor | 170 | Not an NIA or Emerging Neighbourhood |
| Junction-Wallace Emerson | 171 | Not an NIA or Emerging Neighbourhood |
| Dovercourt Village | 172 | Not an NIA or Emerging Neighbourhood |
| North Toronto | 173 | Not an NIA or Emerging Neighbourhood |
| South Eglinton-Davisville | 174 | Not an NIA or Emerging Neighbourhood |
The neighbourhood boundaries were developed by the City of Toronto in the mid-1990s to help government and community agencies with their local planning by providing socio-economic data at a meaningful geographic scale. At the time no boundaries existed to analyse data at the neighbourhood level. The only alternative was to use Statistics Canada census tracts, which are often too small for analysis purposes and not easy for the public to identify with.
Therefore the approach taken was to aggregate census tracts as the building blocks while providing neighbourhoods with a historical identity. Three major assumptions were used before the process began:
Not all people define ‘neighbourhood’ the same way. For the purposes of planning and statistical reporting however, these neighbourhoods were defined based on Statistics Canada census tracts. Census tracts include several city blocks and have on average about 4,000 people. Most service agencies have service areas that are defined by main streets, former municipal boundaries, or natural boundaries such as rivers.
These service areas include several census tracts. It is not uncommon for service areas of community agencies to overlap. Choices about neighbourhood boundaries were made to make the data in the profiles useful to as many users as possible, and are not intended to be definitive statements or judgements about where a neighbourhood starts or ends. The boundaries for these neighbourhoods were developed using the following criteria:
Input was received by the following stakeholders in the preparation of the final set:
The following limitations should be noted when using these boundaries: