This page shares monthly average data from Central Intake on the numbers of calls handled, the number of calls that received referrals, and the number of callers who are unmatched to shelter at the end of the day (at 4 a.m.) for the last 24 months. The daily values dating back to November 2020 are available on Open Data. Data on this page and on Open Data is updated monthly.
Central Intake provides a 24/7 telephone based service that offers referrals to emergency shelter and other overnight accommodation, as well as information about other housing stability services. Learn more about Central Intake and its work.
Data on Central Intake Calls and System Capacity
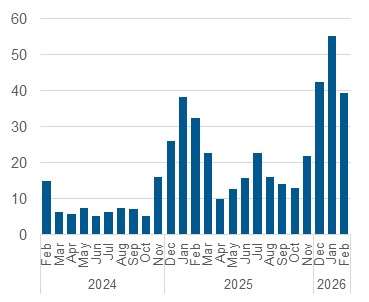
Average daily number of calls resulting in a referral to a shelter space
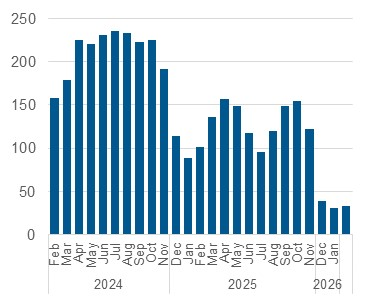
Average daily number of unmatched individual callers
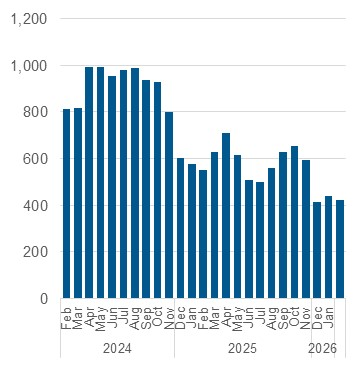
Average daily number of calls handled
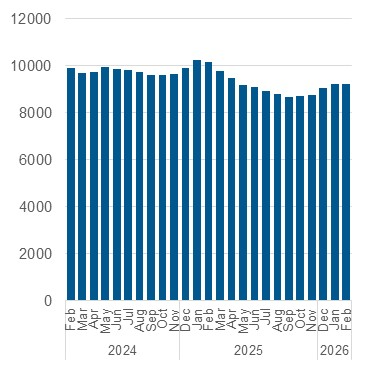
Average nightly occupancy, shelter and overnight service system
| Year/ Month |
Average daily number of calls resulting in referral to a shelter space [1] |
Average daily number of unmatched individual callers [2] |
Average daily number of calls handled [3] |
Average nightly shelter & overnight service occupancy [4] |
| 2024 |
Feb |
15.0 |
158.4 |
812 |
9,885 |
|
Mar |
6.3 |
178.3 |
819 |
9,695 |
|
Apr |
5.7 |
224.5 |
991 |
9,734 |
|
May |
7.3 |
220.2 |
993 |
9,936 |
|
Jun |
5.2 |
231.1 |
955 |
9,850 |
|
Jul |
6.2 |
235.7 |
978 |
9,815 |
|
Aug |
7.3 |
233.0 |
987 |
9,713 |
|
Sep |
7.1 |
223.0 |
936 |
9,615 |
|
Oct |
5.2 |
225.1 |
929 |
9,603 |
|
Nov |
16.0 |
191.6 |
799 |
9,623 |
|
Dec |
25.9 |
114.1 |
604 |
9,911 |
| 2025 |
Jan |
38.3 |
89.0 |
577 |
10,228 |
|
Feb |
32.4 |
101.0 |
553 |
10,150 |
|
Mar |
22.6 |
135.9 |
628 |
9,778 |
|
Apr |
9.9 |
156.6 |
708 |
9,447 |
|
May |
12.7 |
148.7 |
614 |
9,181 |
|
June |
15.8 |
117.3 |
509 |
9,065 |
|
July |
22.5 |
95.7 |
500 |
8,900 |
|
Aug |
16.1 |
119.8 |
561 |
8,765 |
|
Sep |
13.9 |
148.5 |
627 |
8,649 |
|
Oct |
12.9 |
154.8 |
653 |
8,697 |
|
Nov |
21.7 |
122.2 |
596 |
8,742 |
|
Dec |
42.4 |
39.4 |
414 |
9,035 |
| 2026 |
Jan |
55.1 |
30.4 |
440 |
9,217 |
|
Feb |
39.3 |
32.8 |
421 |
9,206 |
[1] Data source: Central Intake Wrap-Up Codes Data.
[2] Data source: Central Intake Service Queue Data.
[3] Data source: Central Intake Wrap-Up Codes Data.
[4] Data source: Daily Shelter & Overnight Service Occupancy & Capacity.
Notes on Interpreting the Data
- This data is used in conjunction with other reports to make decisions about immediate system capacity and to inform longer-term planning of program needs. Review and analysis of this data also helps inform decisions regarding staffing at Central Intake.
- The Wrap-up Codes Data and Service Queue Data are complementary data sets for understanding Central Intake’s outcomes. Wrap-up Codes data reflect the type and outcome assigned to a single call handled by Central Intake. Service Queue data reflects the number of people who are unable to be matched to shelter on a daily basis.
- Central Intake is the main referral pathway, but is not the only source of referrals into the shelter system. For example, the Streets to Homes outreach program also offers referrals to shelter programs, along with housing support.
- Wrap-up Codes data is for the number of calls, whereas Service Queue data is for unique individuals. The Wrap-up Codes Data and Service Queue Data are complementary data sets collected in two different systems that focus on different types of data useful for understanding Central Intake’s outcomes. The two data sets cannot be combined. There is an important distinction in the data between ‘Calls’ and ‘Individuals’ when considering analysis of outcomes. Call data can represent an individual caller, or someone calling on behalf of a couple or family. For this reason, referrals to shelter may serve more than one individual.
- The statistic “average daily number of calls resulting in referral to a space” includes all calls resulting in a referral for families and singles/couples. The statistic “average daily number of unmatched individuals” only includes callers who are seeking space for a single or couple. People seeking space in family sector programs are supported through a different process that ensures they have indoor accommodations while waiting for access to shelter.