The Development Pipeline is an analytical dataset from Toronto City Planning that shows where and how development is taking shape across the city. It brings together Planning application and building permit data to analyze project-level development trends over a rolling five-year period. This approach ensures that each housing unit and square metre of non-residential space is counted only once, even when a project involves multiple approvals over time. The Development Pipeline focuses on larger developments that require Planning approvals under the Planning Act, such as changes to land use and zoning regulations, site design, land division, and condominium development. It does not include “as-of-right” development below the Site Plan Control threshold.
This information helps residents, businesses, and decision-makers understand where growth is happening, how it aligns with the City’s Official Plan, what types of development are proposed, and how projects progress from early applications through construction and occupancy. The Development Pipeline provides a reliable, citywide snapshot of growth patterns and future development potential in Toronto, offering insight into how development projects support the city’s long-range growth targets.
You can explore this information through the Development Activity 2025 summary, the Development Activity 2025 bulletin, a regularly updated interactive dashboard, and open data downloads.
The Development Pipeline Dashboard is an interactive tool to explore the Development Pipeline dataset. Users can learn more about development activity in select areas by using the geographic filters or by drawing custom areas on the map. The dashboard is updated more regularly than the published bulletin and may reflect more up-to-date information.
Toronto is growing with strong development prospects helping to bring more people and jobs into the City.
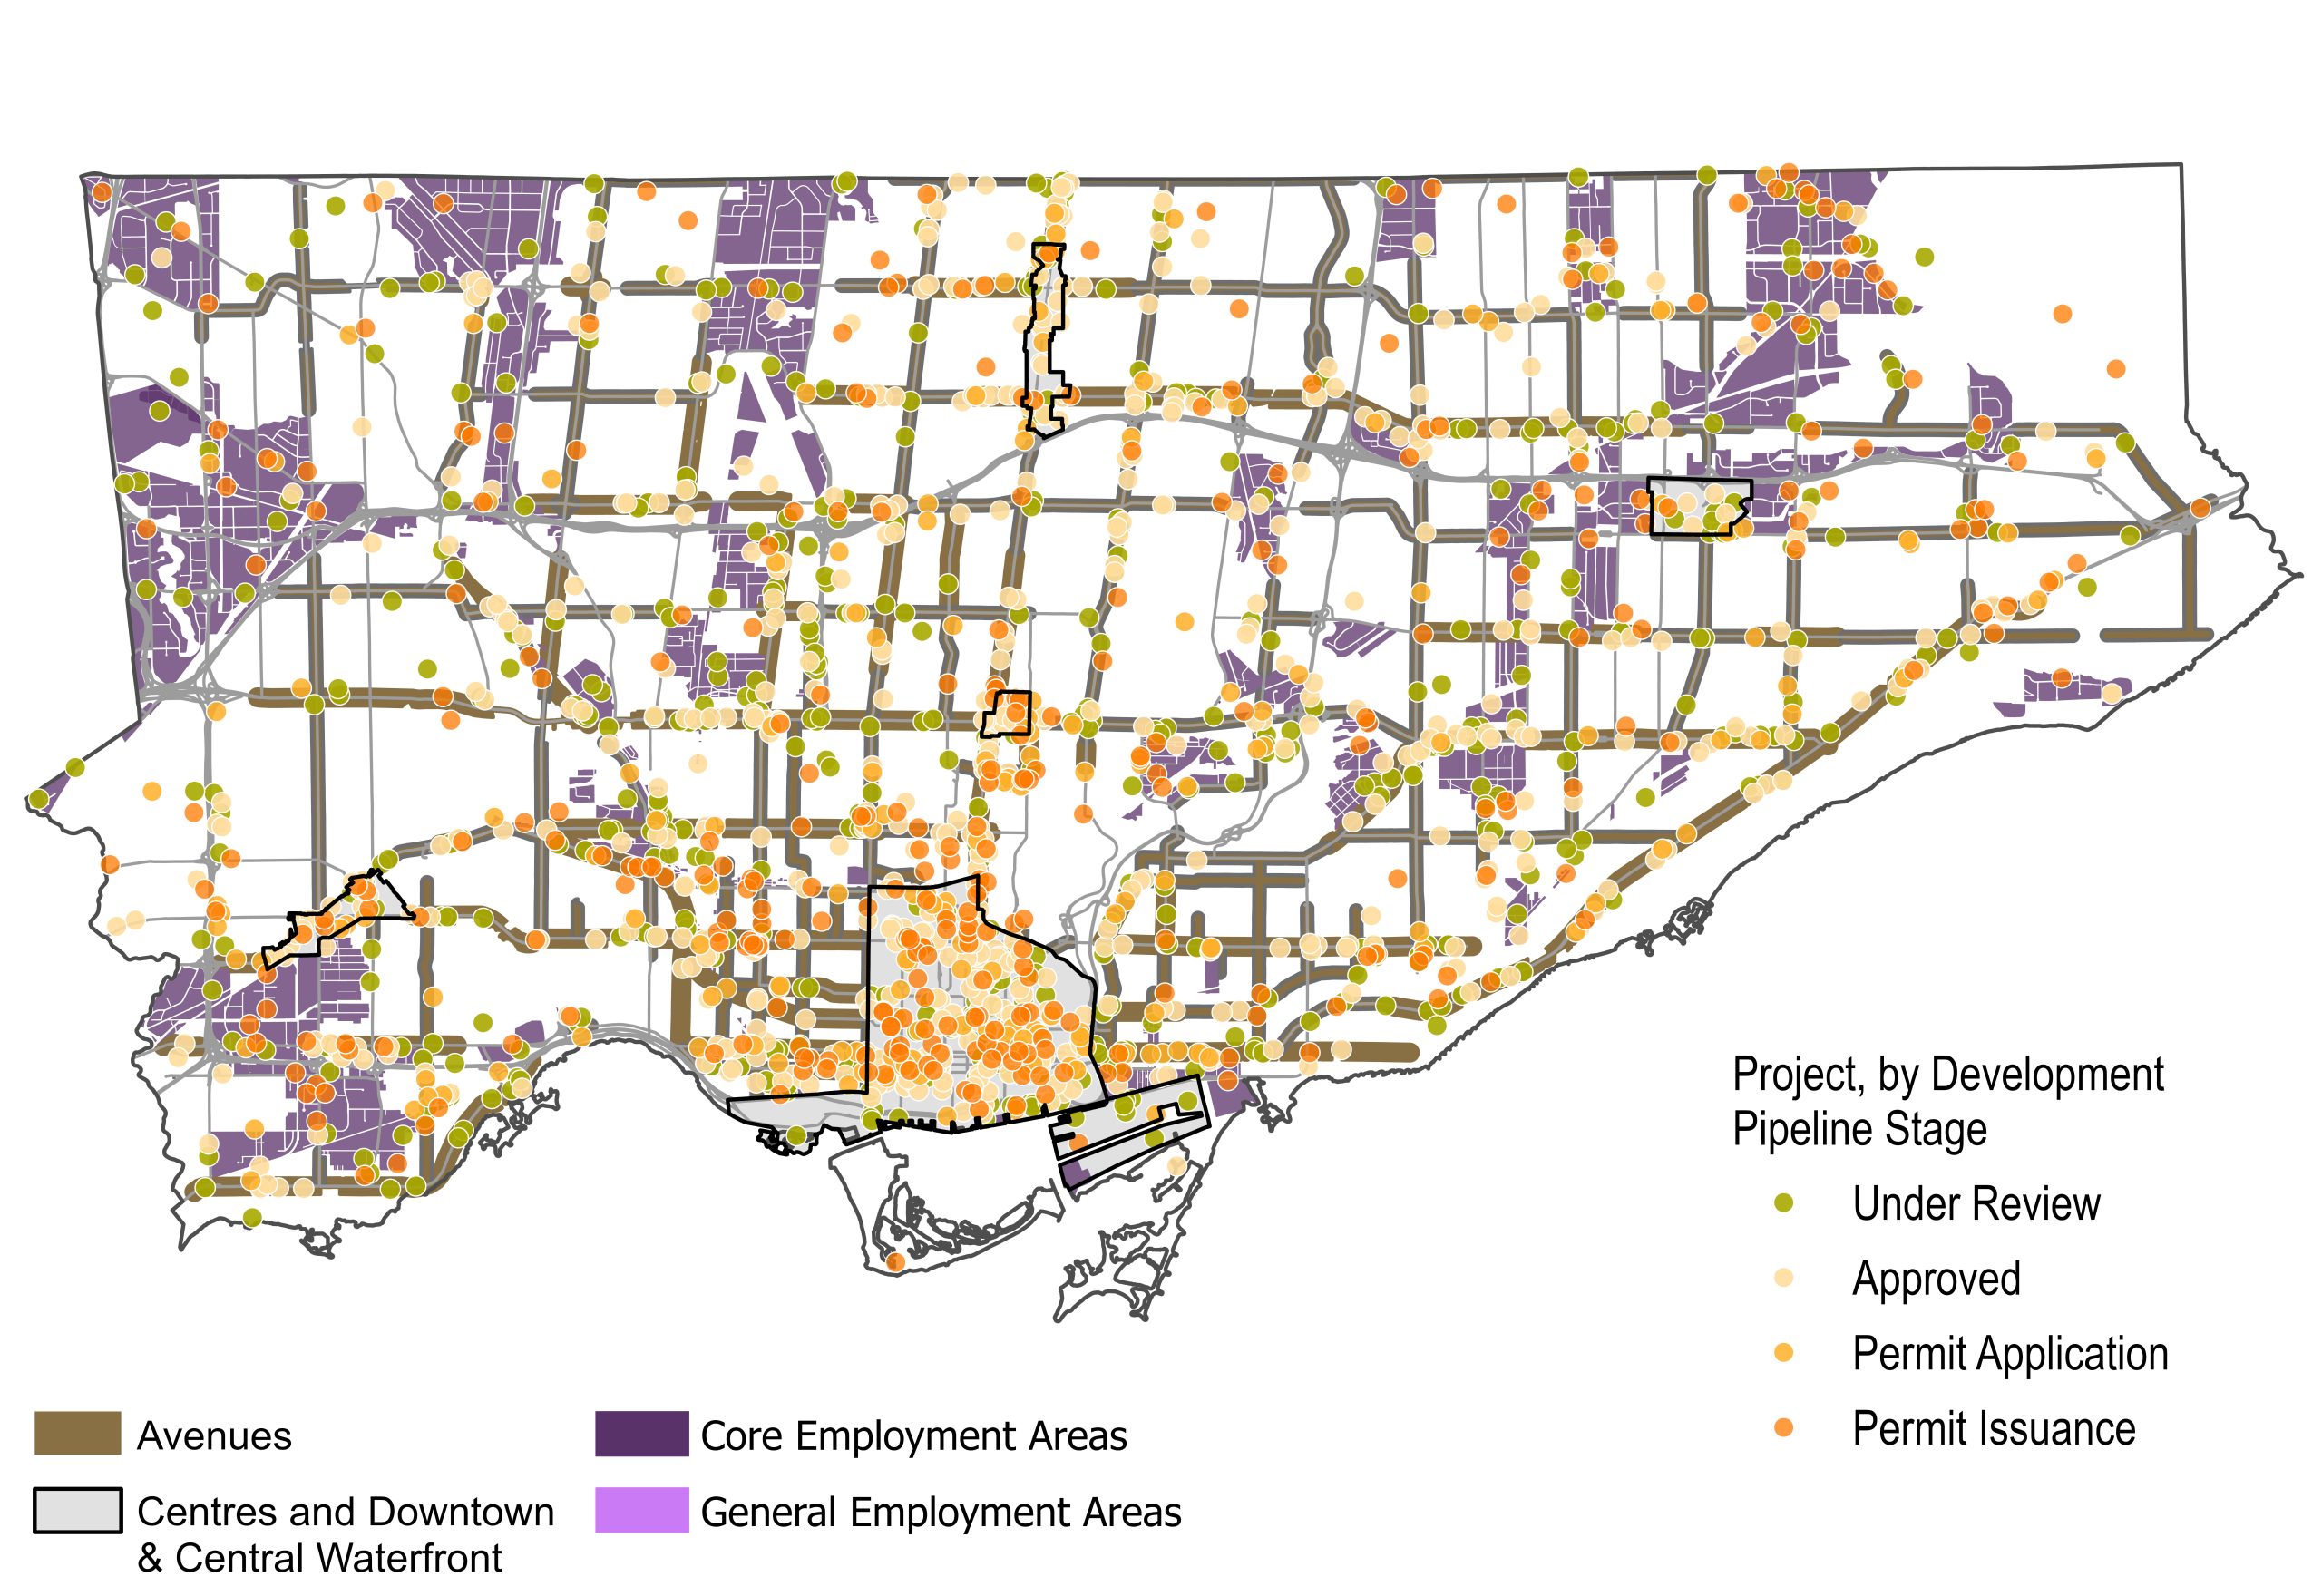
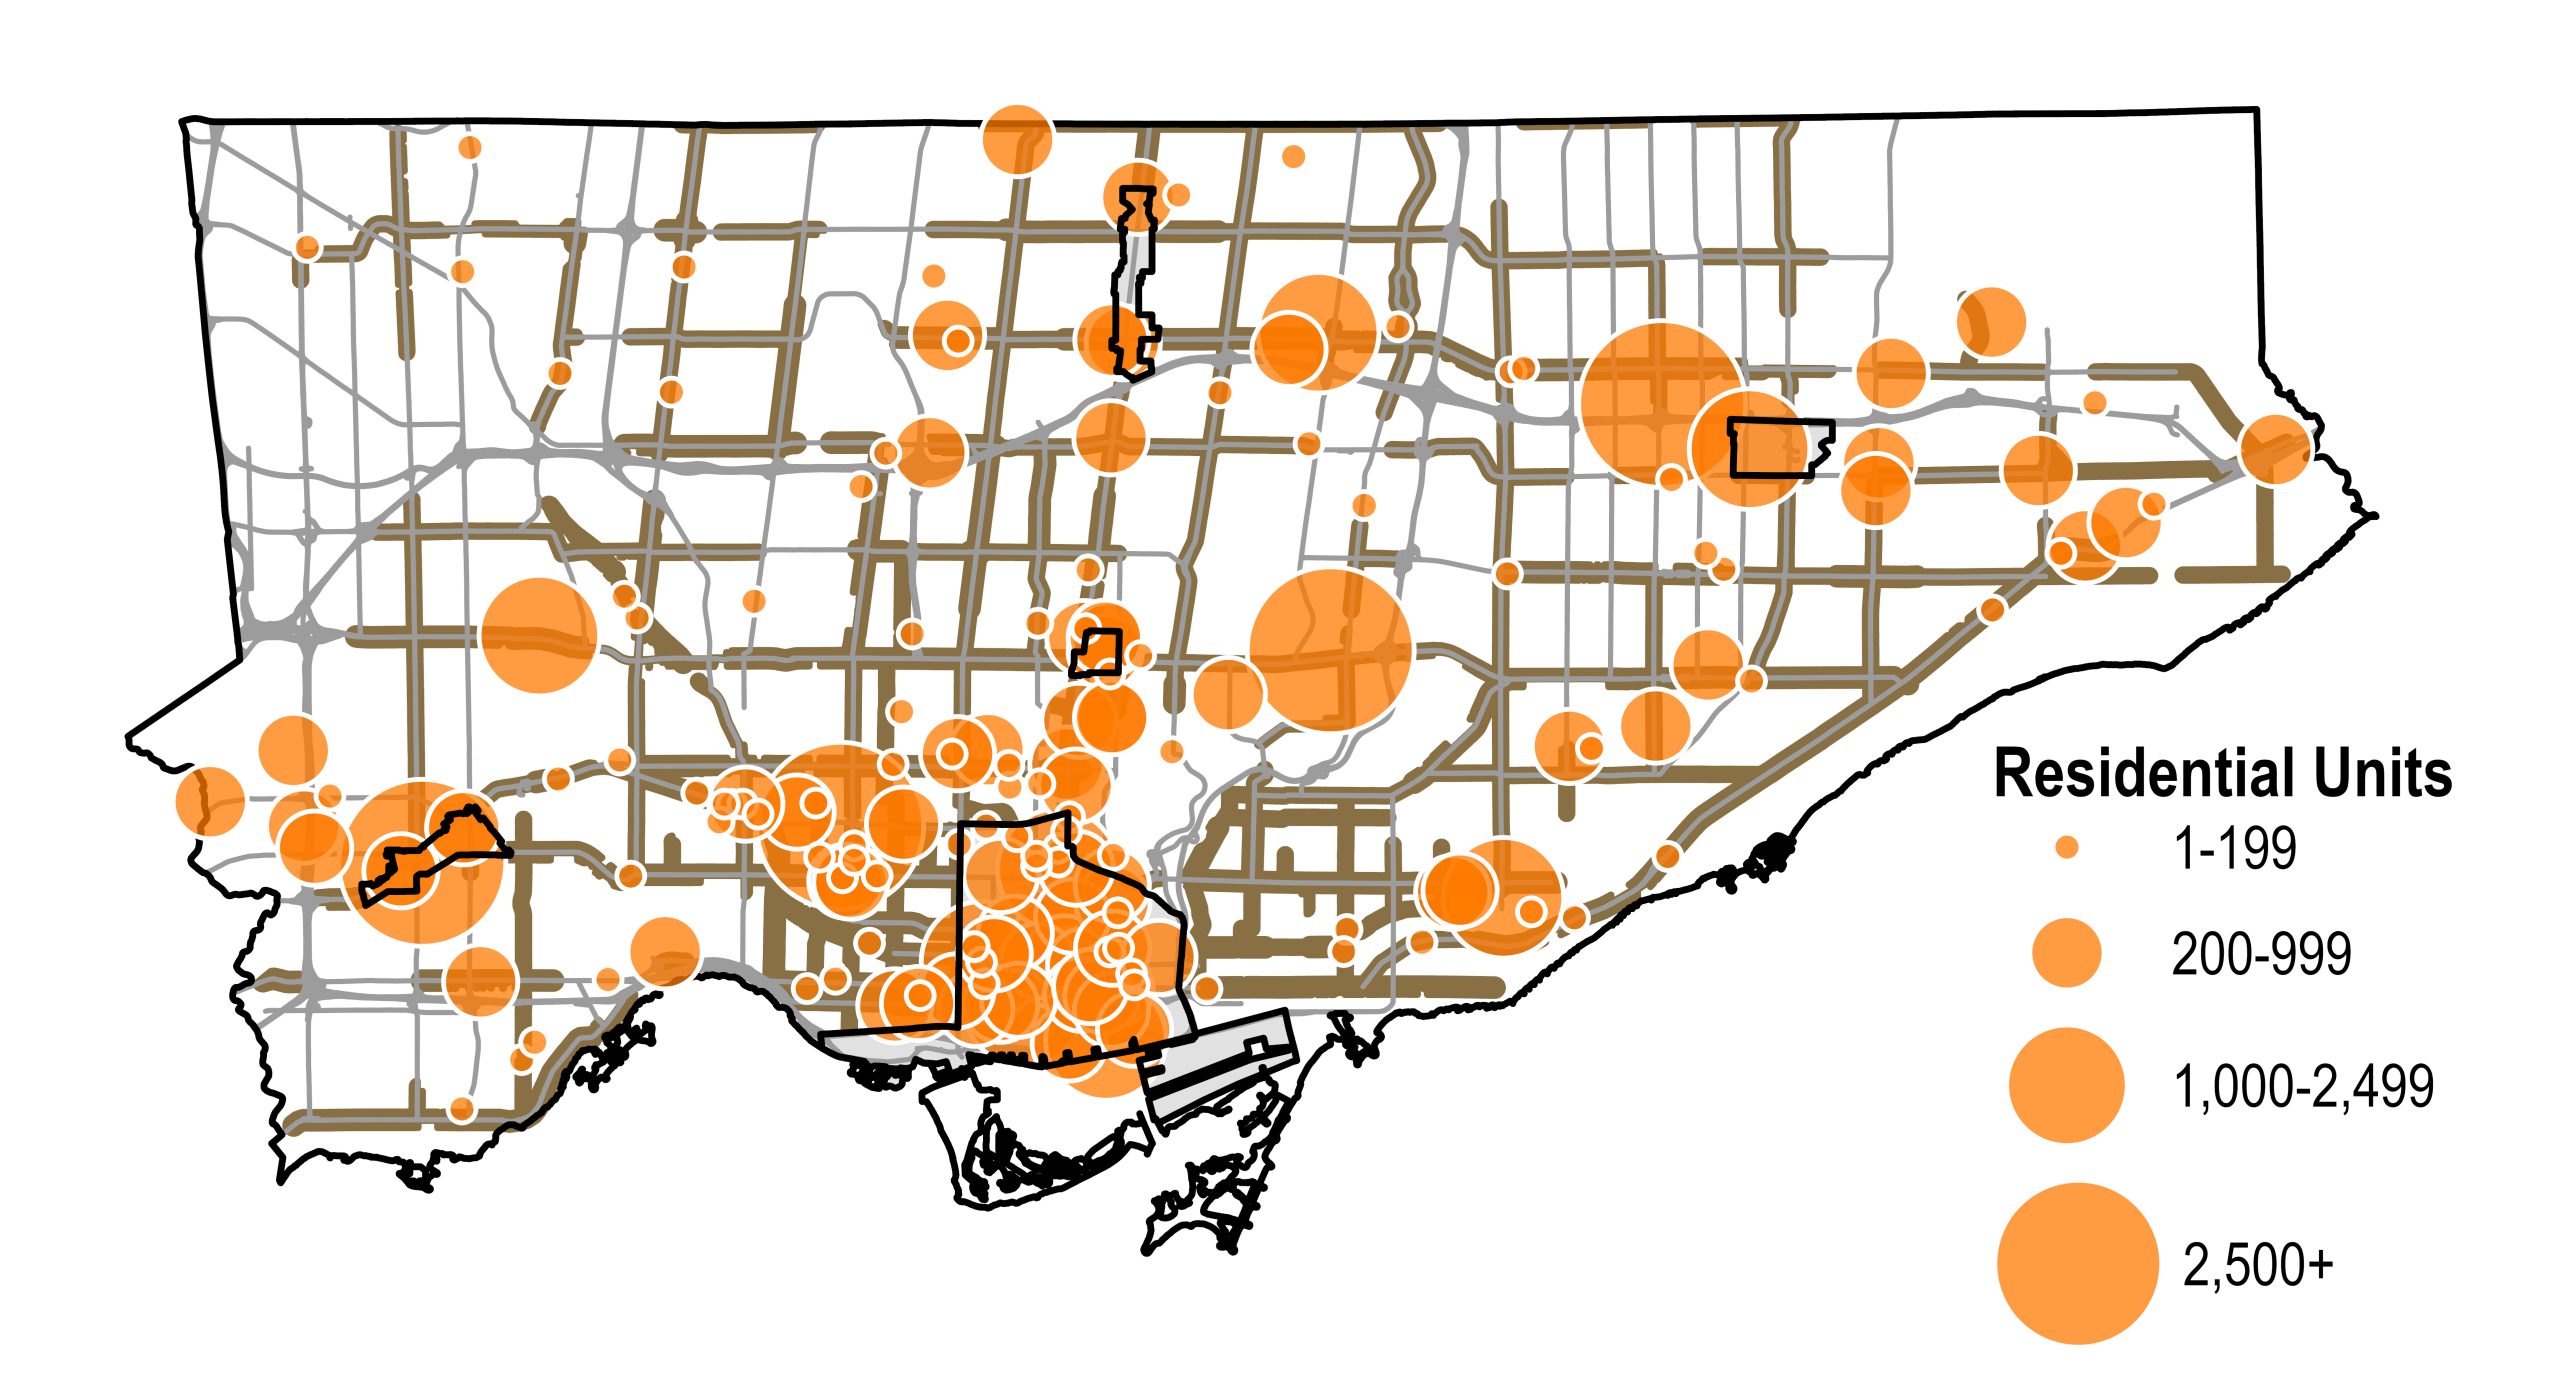
The maps below show proposed units in development projects with activity between January 1, 2021 and December 31, 2025. While we strive to make all content fully accessible, some materials—particularly maps, drawings, and data visualizations—may be difficult to present in fully accessible formats. If you require alternative formats or need assistance understanding this content, please contact Hailey Toft, City Planning, cityplanning@toronto.ca, 416-392-8343.
Residential development in the Pipeline continues to show growth, reaching a new record high in 2025. Almost half of all proposed residential units are in projects that are Under Review. The 2025 Development Pipeline includes over 791,000 proposed residential units, an increase of 7 per cent from 2024.
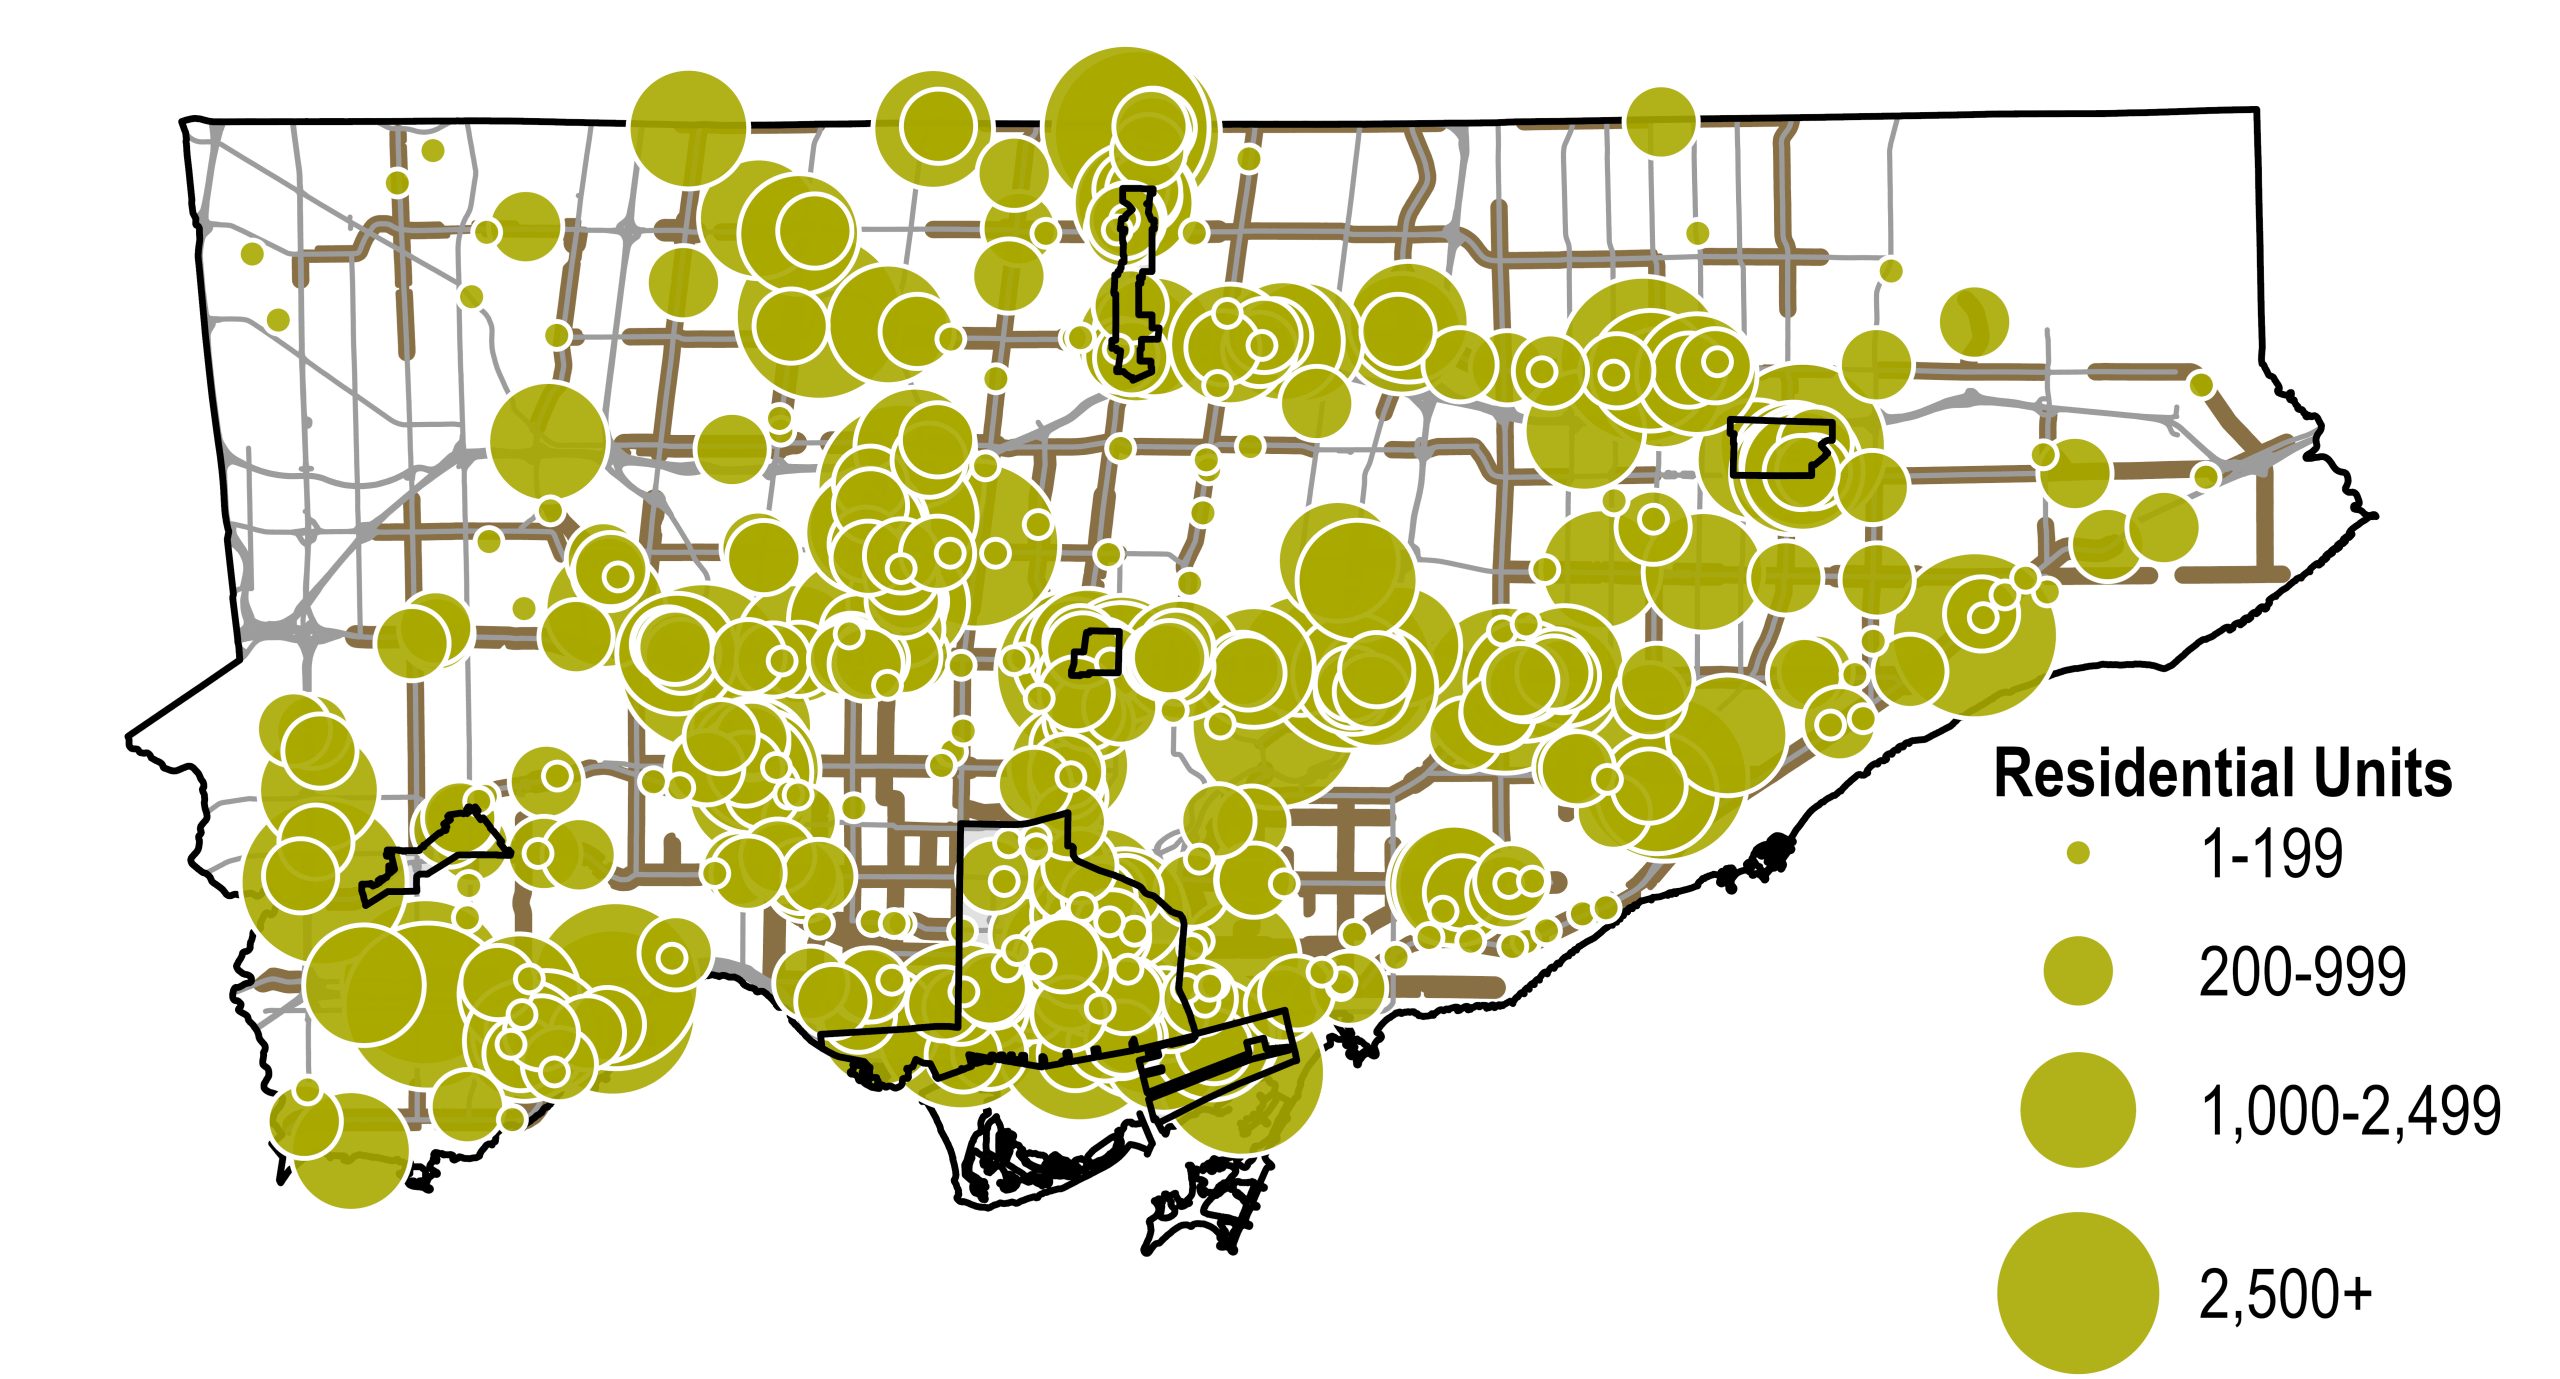
Under Review projects are projects that have been submitted and deemed complete and have not yet been approved or refused by the City or are under appeal at the Ontario Land Tribunal.
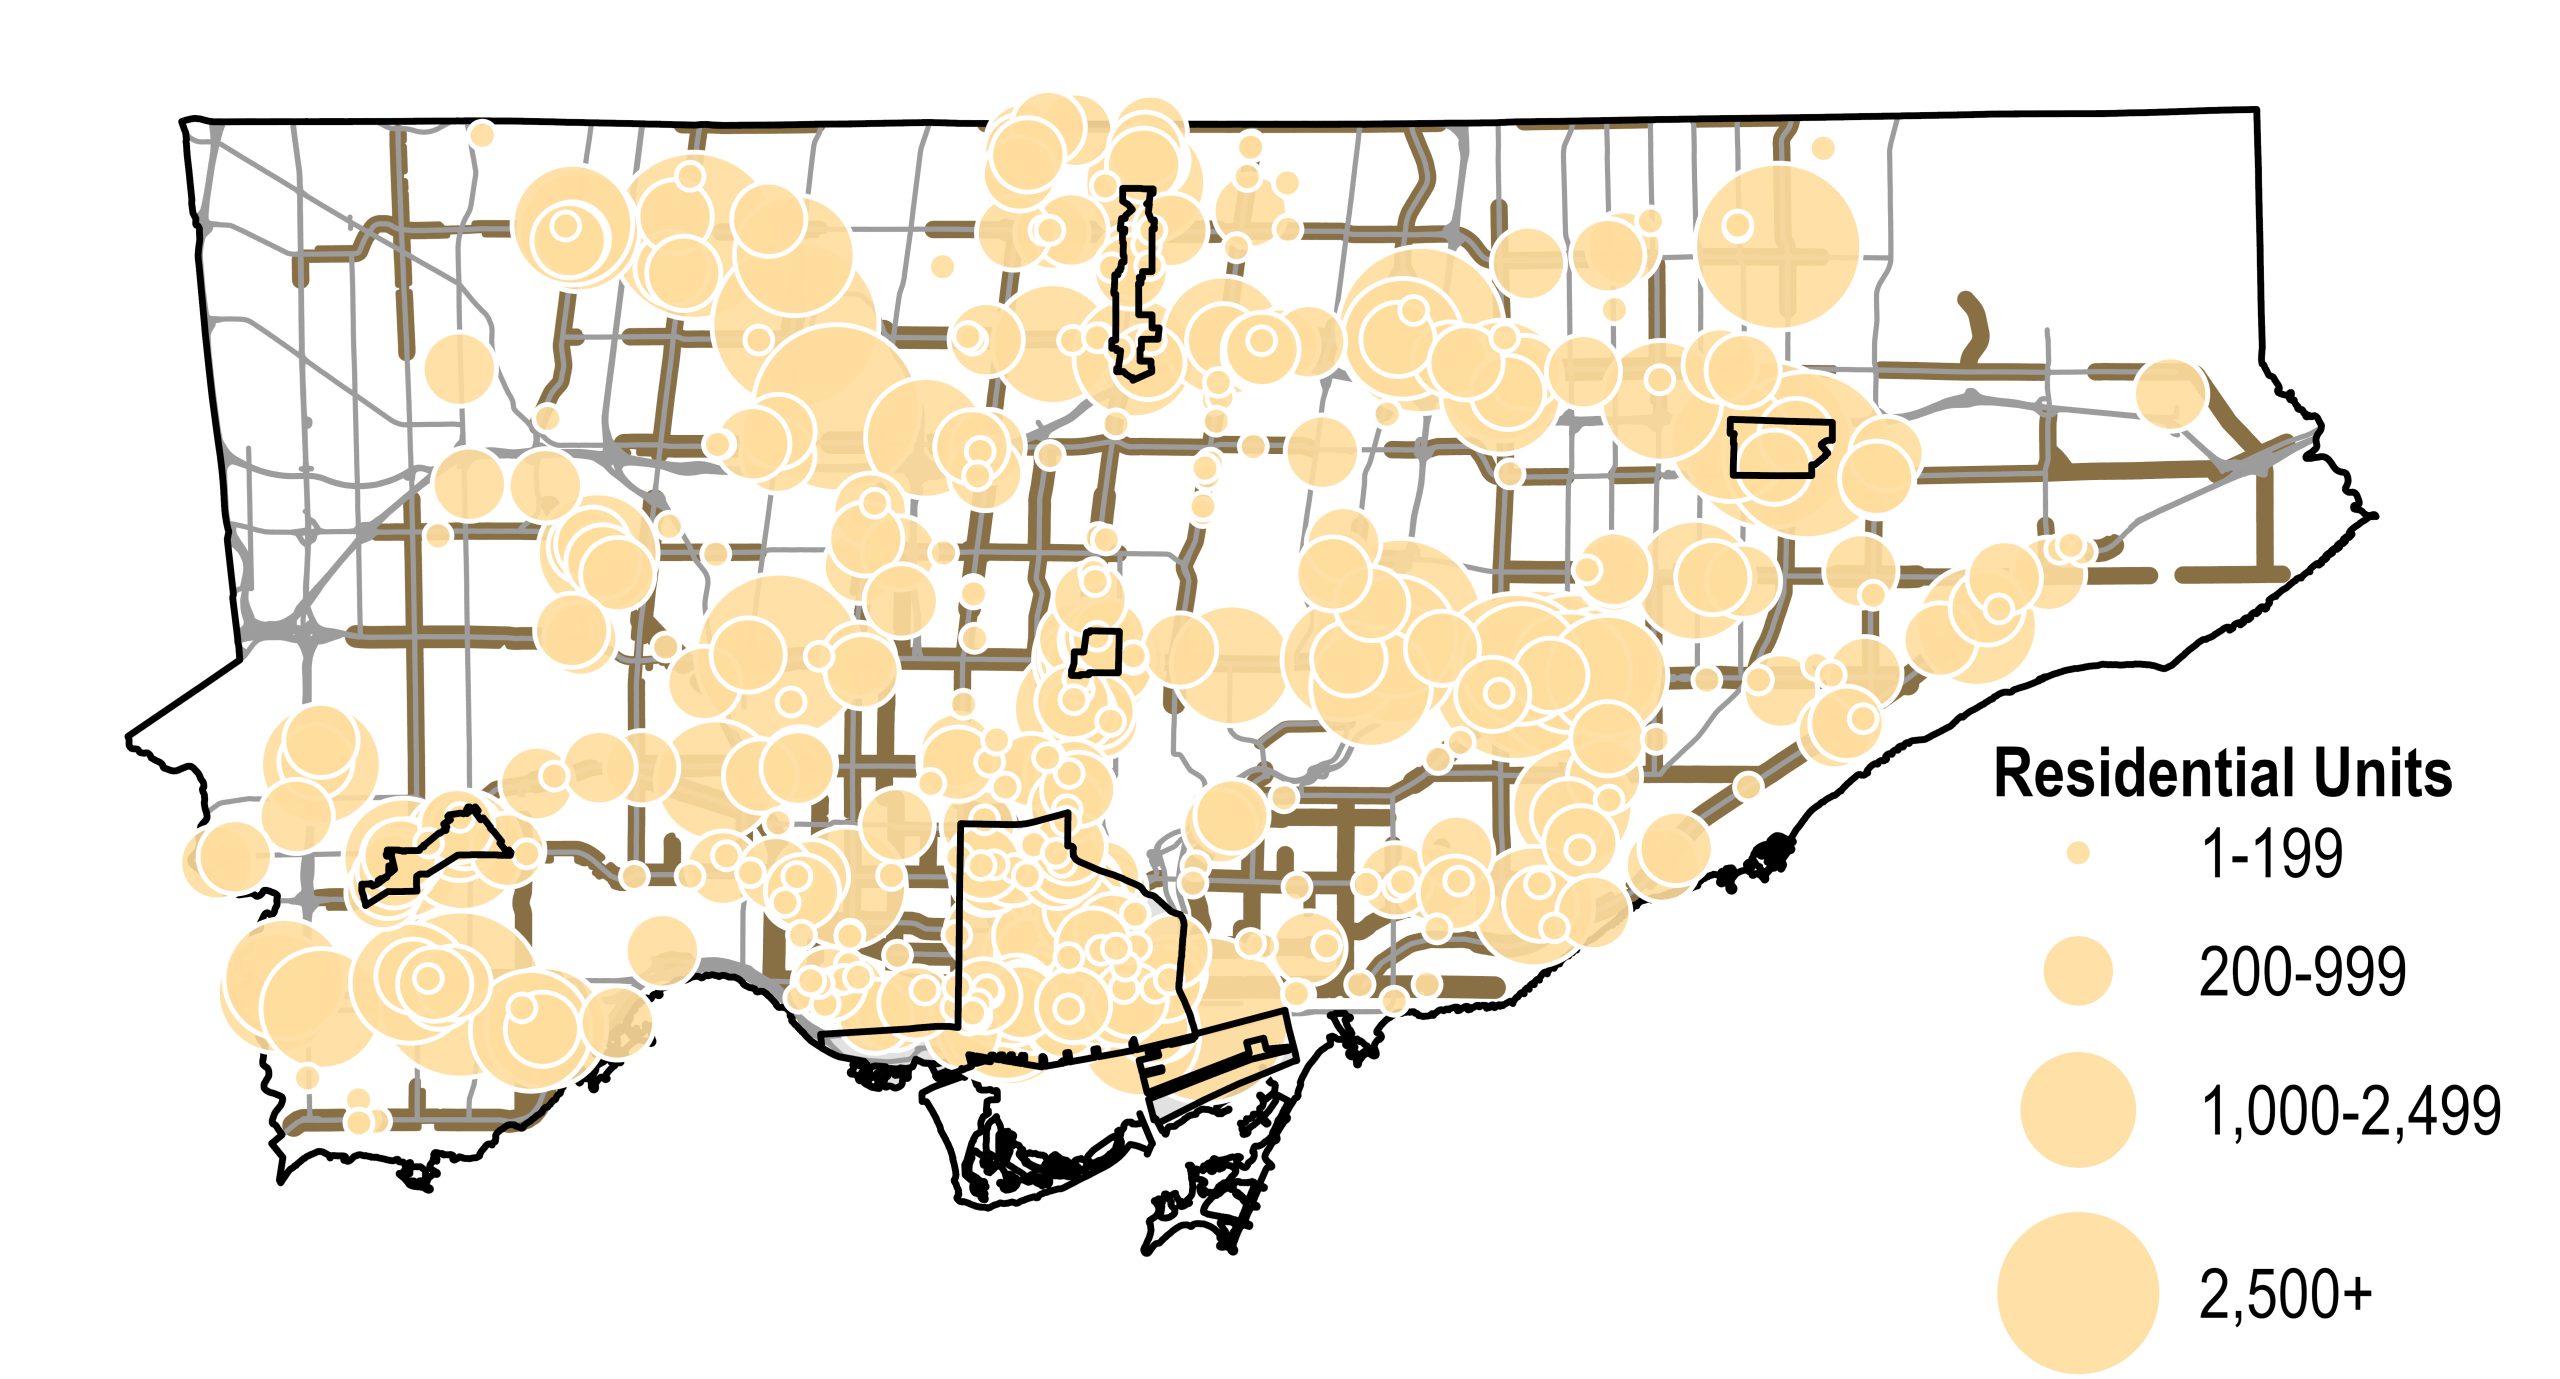
Approved projects are projects with at least one Planning approval, including projects that have received all necessary Planning approvals but have not yet applied for Building Permits. Approval types include Council approval, Delegated approval (by City staff) and Ontario Land Tribunal (OLT) Decisions.
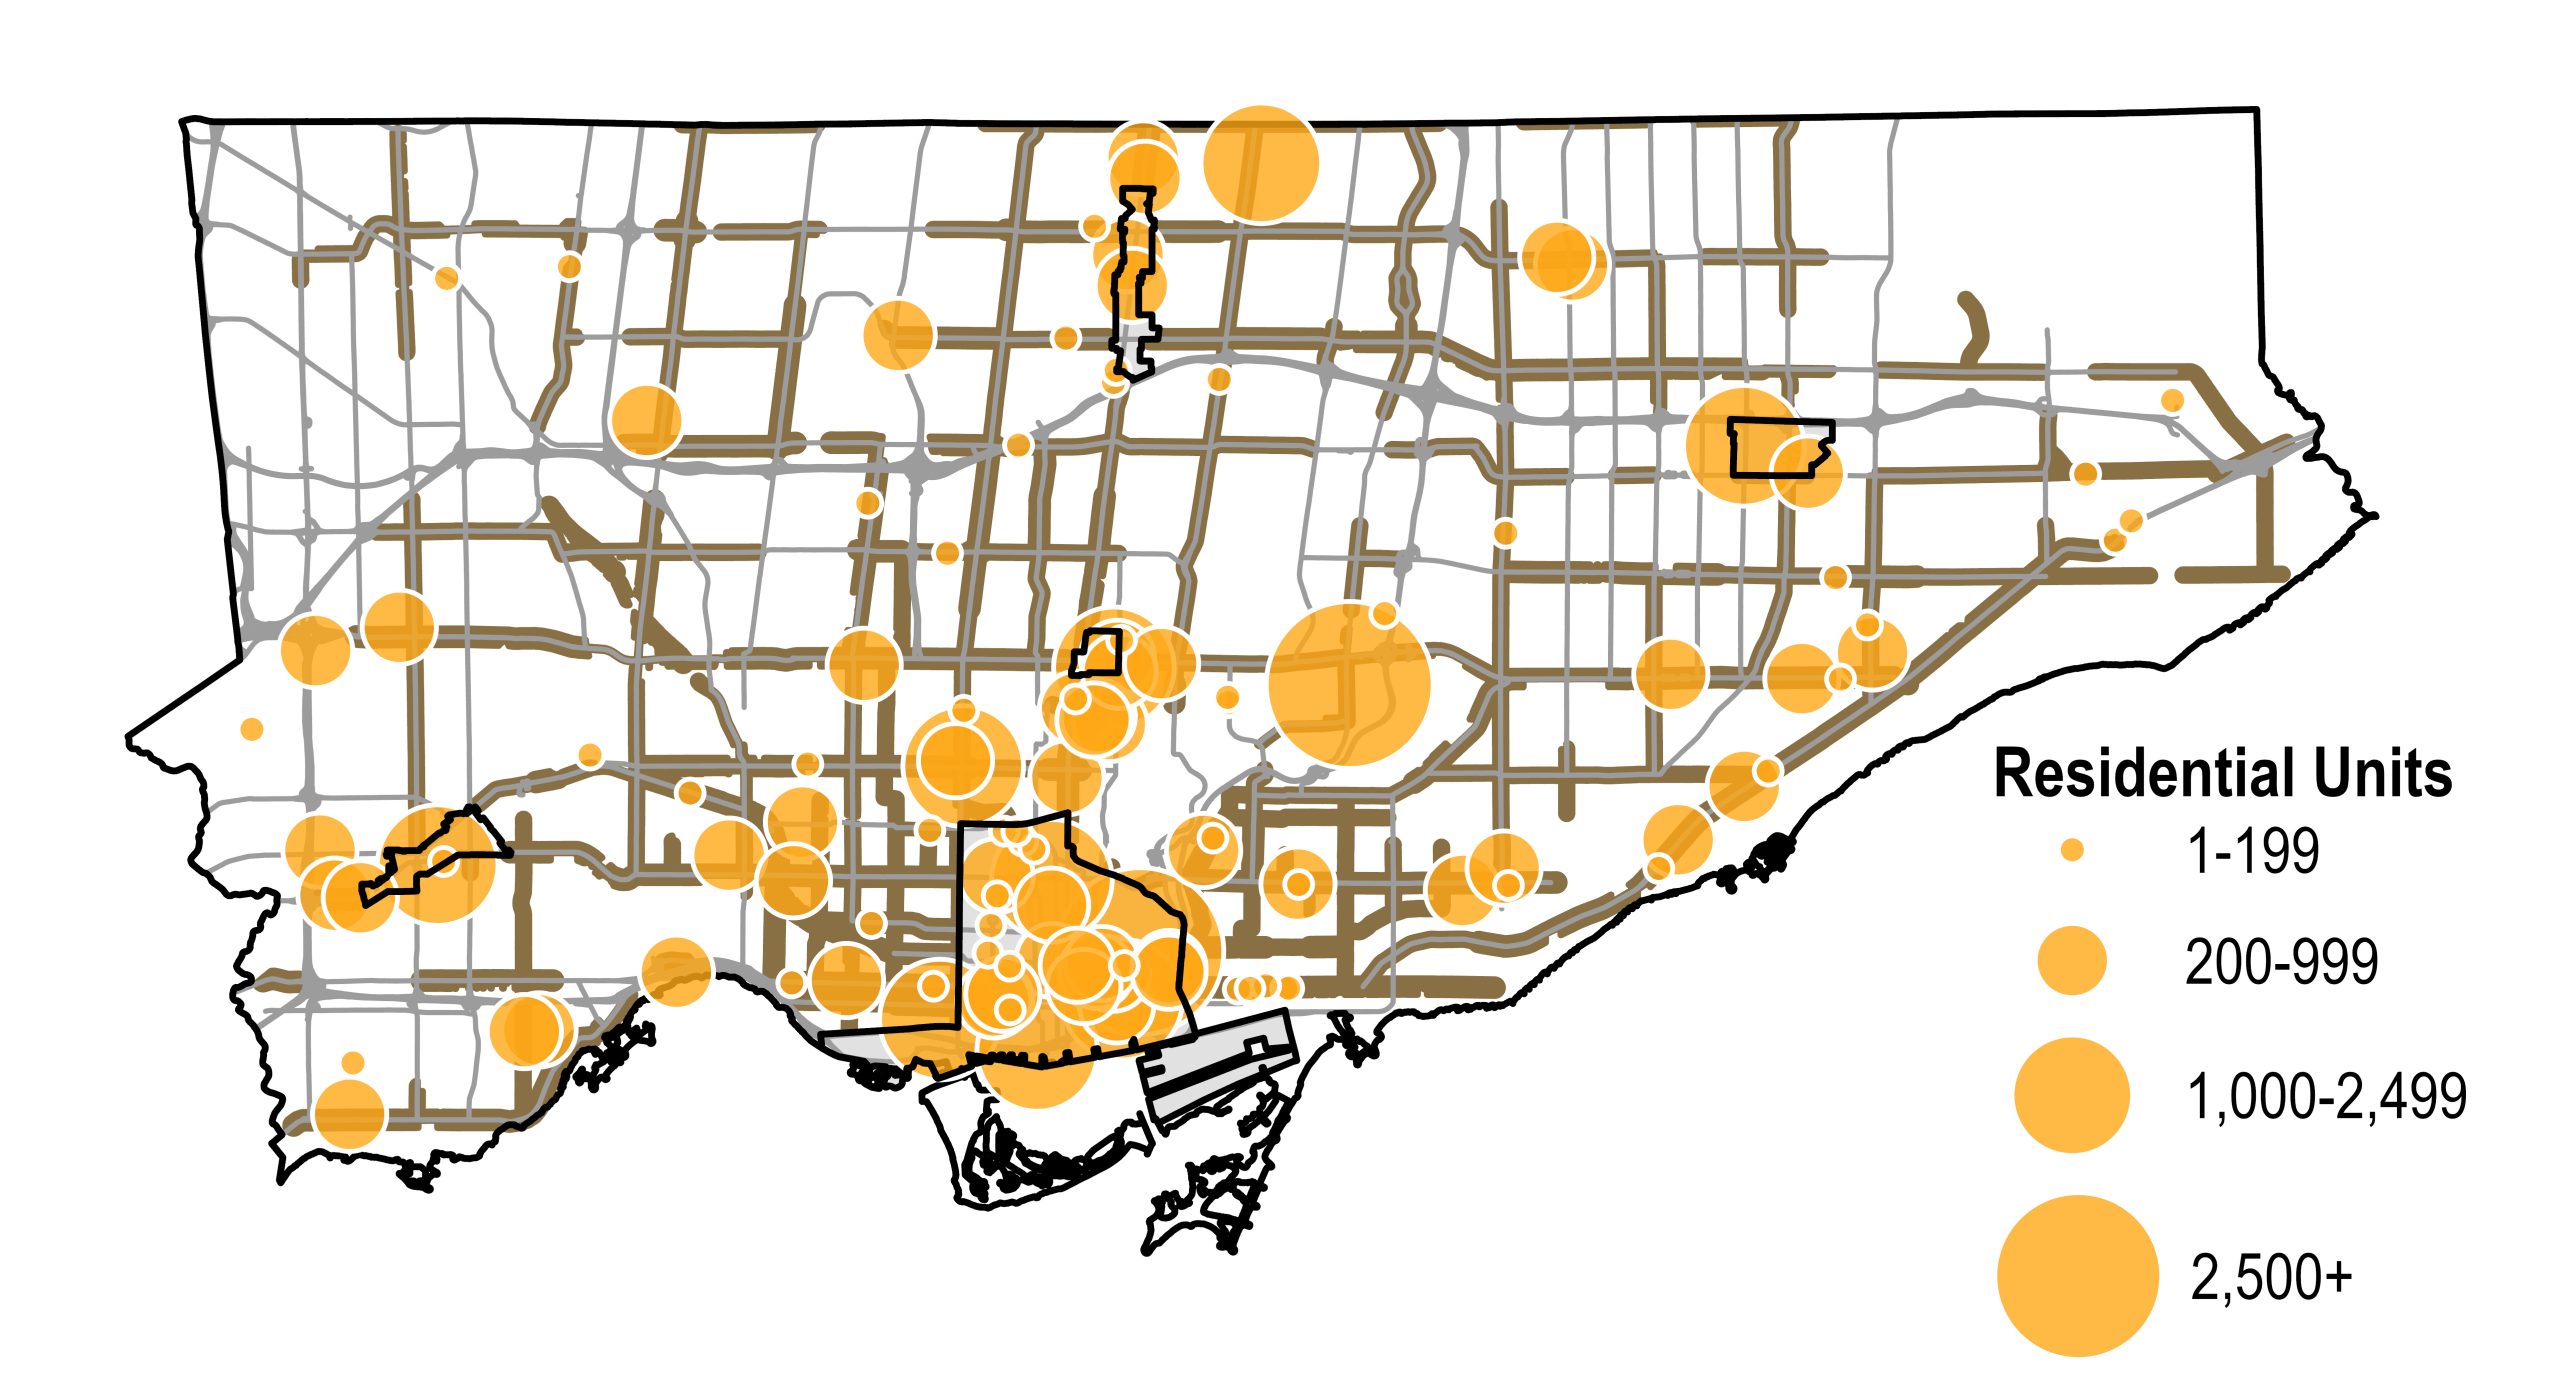
Projects at the Permit Application stage are those with at least one Planning approval that have applied for but have not yet been issued a Building Permit.
Projects at the Permit Issued stage are those that have at least one Planning approval and have been issued Building Permits and may be under construction but are not yet built.
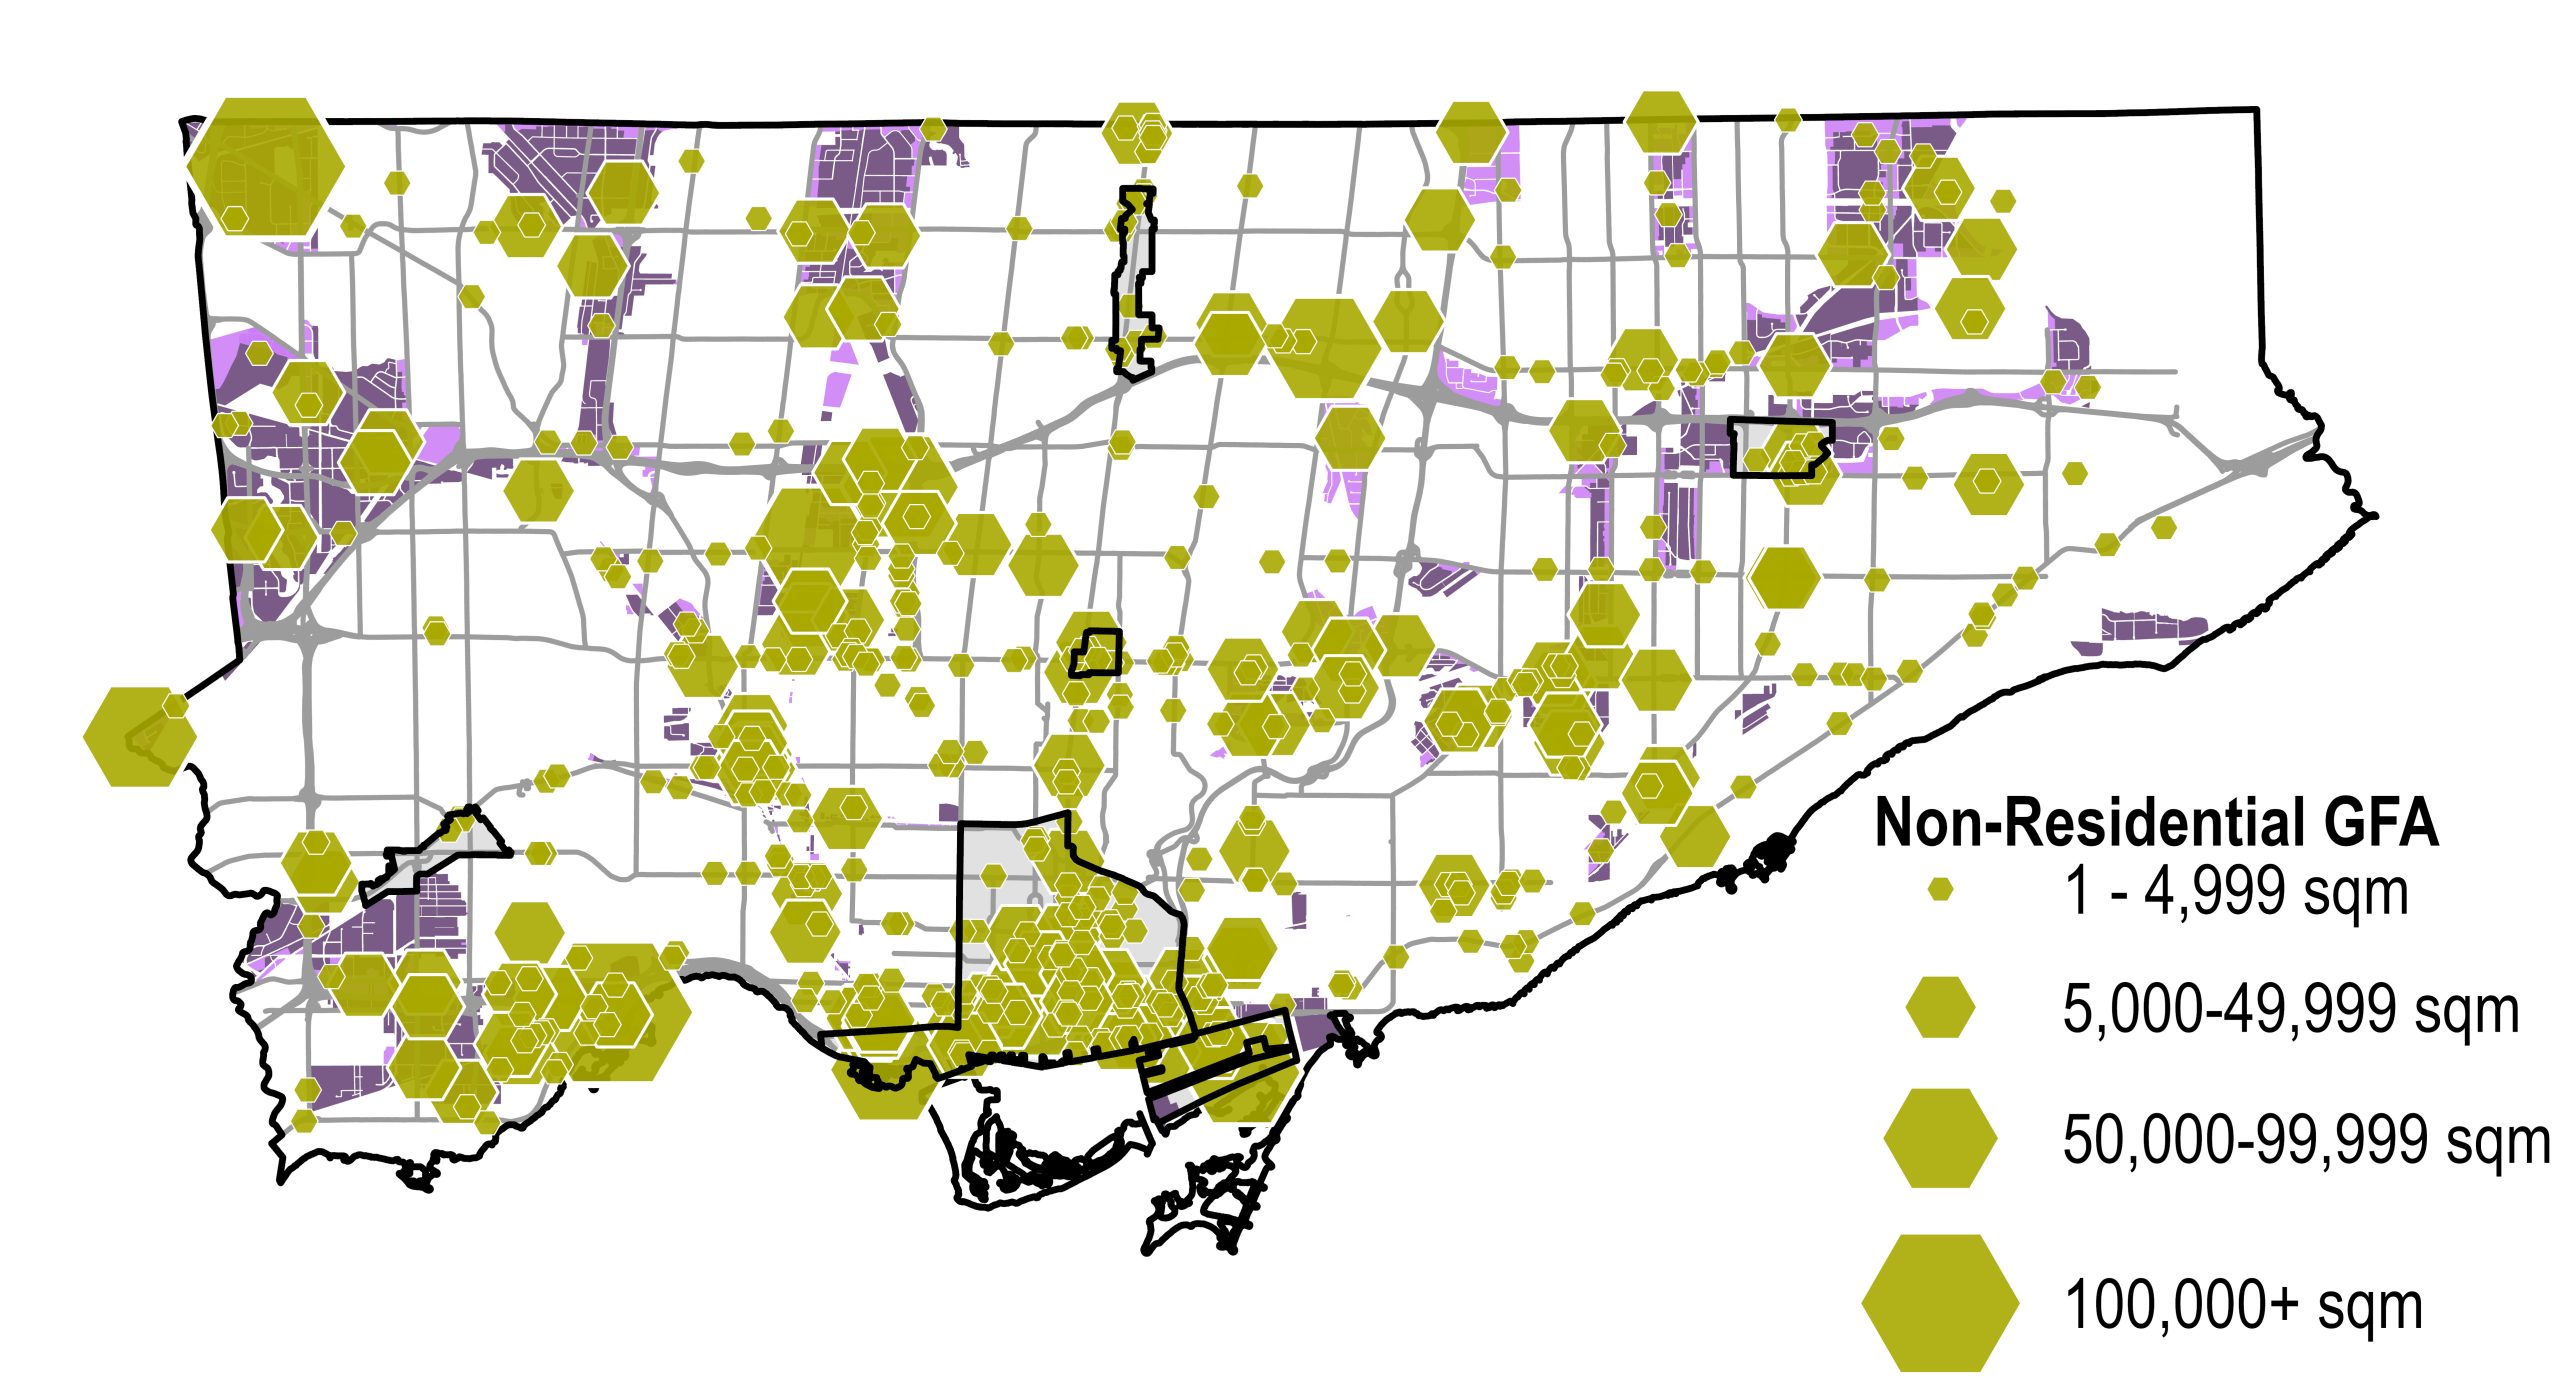
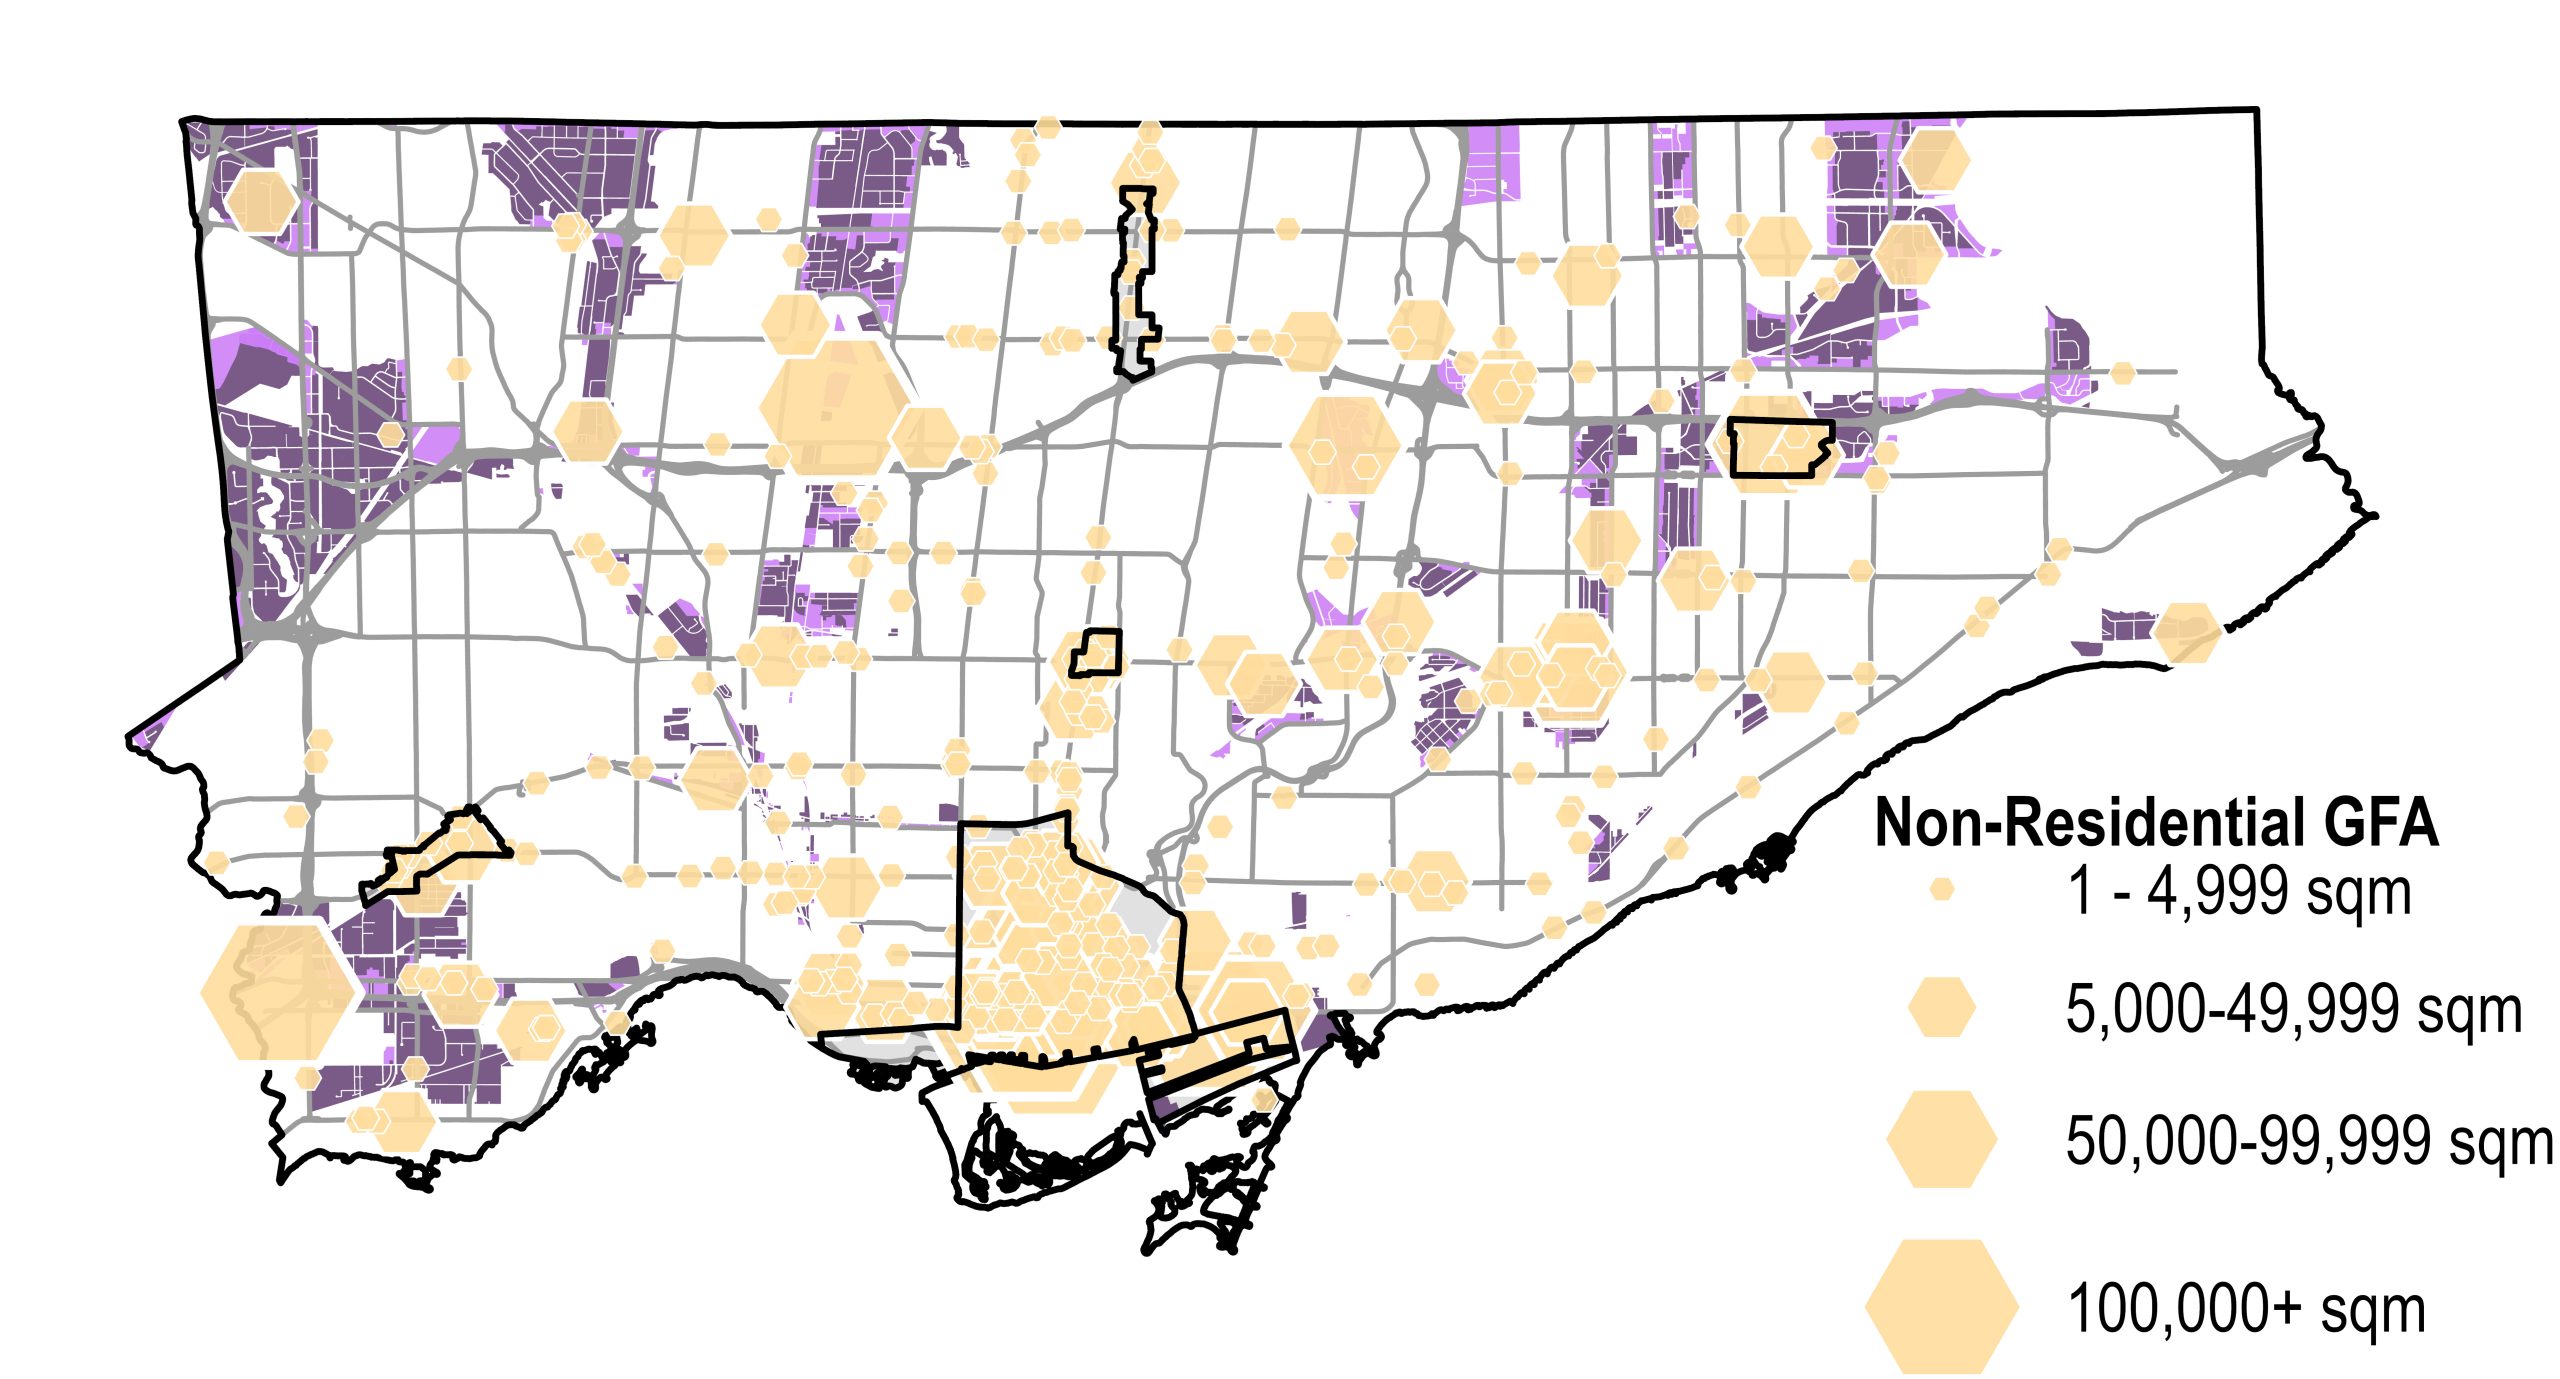
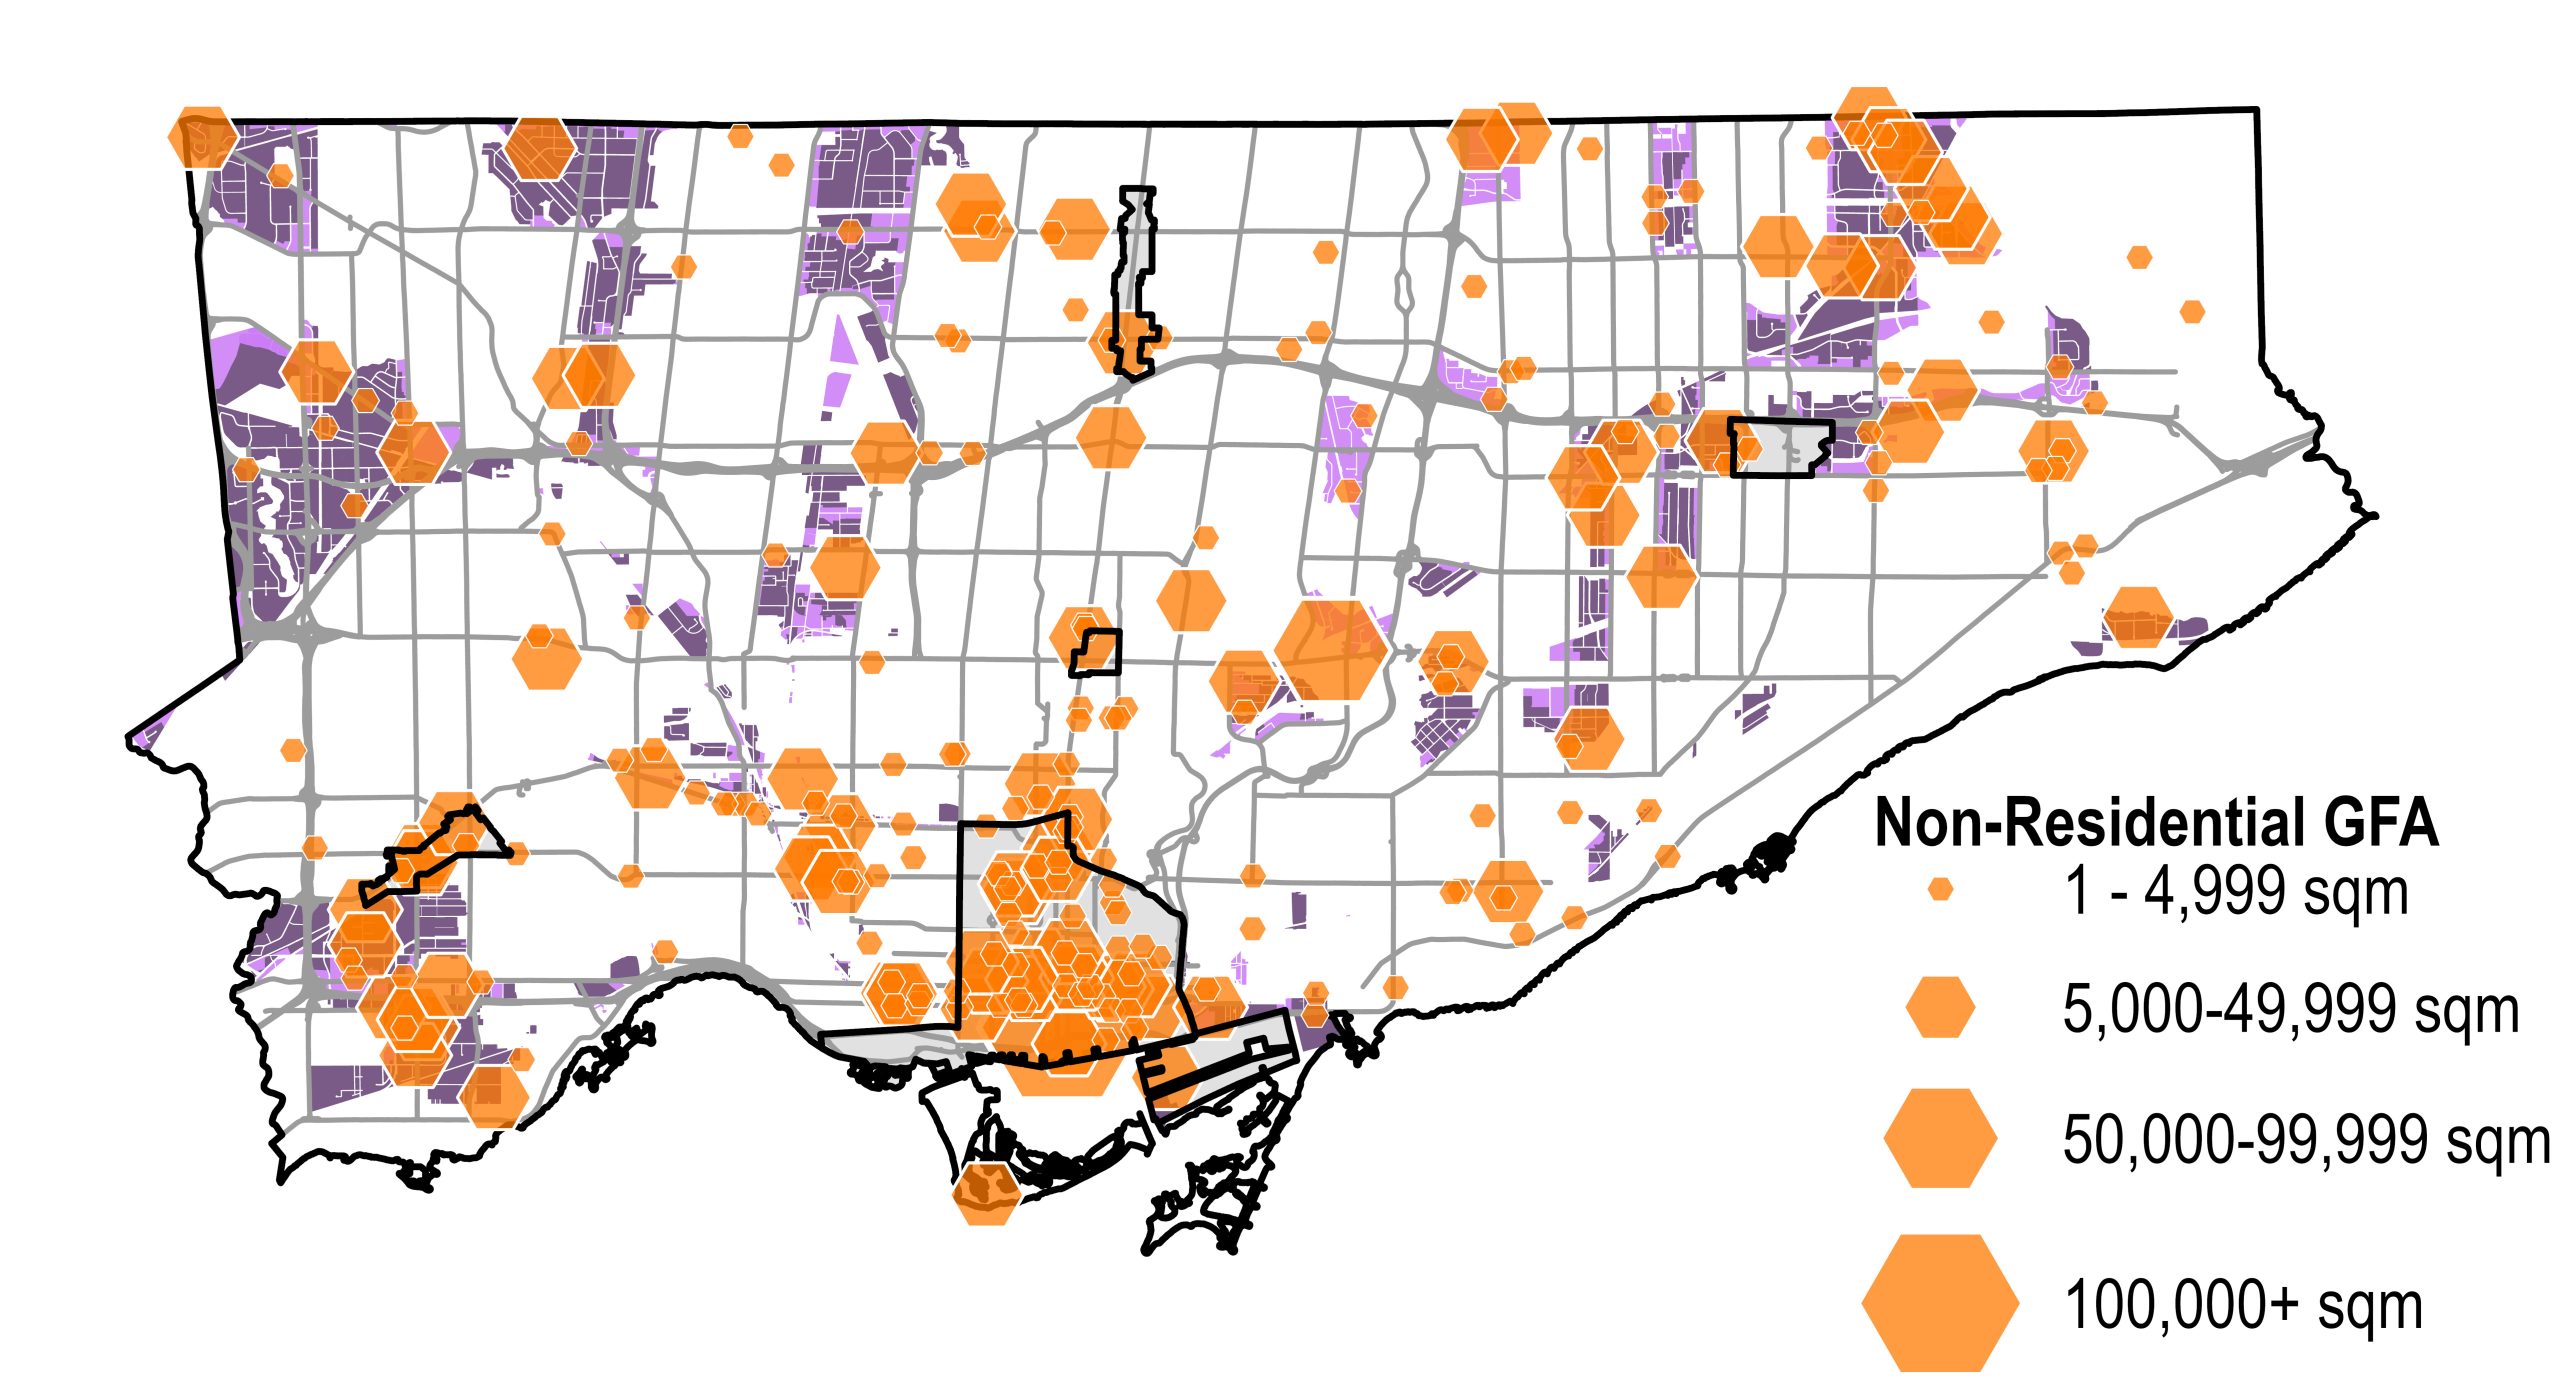
The maps below show proposed non-residential GFA in development projects with activity between January 1, 2021 and December 31, 2025. While we strive to make all content fully accessible, some materials—particularly maps, drawings, and data visualizations—may be difficult to present in fully accessible formats. If you require alternative formats or need assistance understanding this content, please contact Hailey Toft, City Planning, cityplanning@toronto.ca, 416-392-8343.
Non‑residential development plays a critical role in the long‑term economic health of the city by supporting employment, economic activity, and access to jobs alongside housing growth.
The 2025 Development Pipeline includes over 8.9 million square metres of proposed non-residential space, a decrease of 15% from 2024.
Under Review projects are projects that have been submitted and deemed complte and have not yet been approved or refused by the City or are under appeal at the Ontario Land Tribunal.
Approved projects are projects with at least one Planning approval, including projects that have received all necessary Planning approvals but have not yet applied for Building Permits. Approval types include Council approval, Delegated approval (by City staff) and Ontario Land Tribunal (OLT) Decisions.
Projects at the Permit Application stage are those with at least one Planning approval that have applied for but have not yet been issued a Building Permit.
Projects at the Permit Issued stage are those that have at least one Planning approval and have been issued Building Permits and may be under construction but are not yet built.
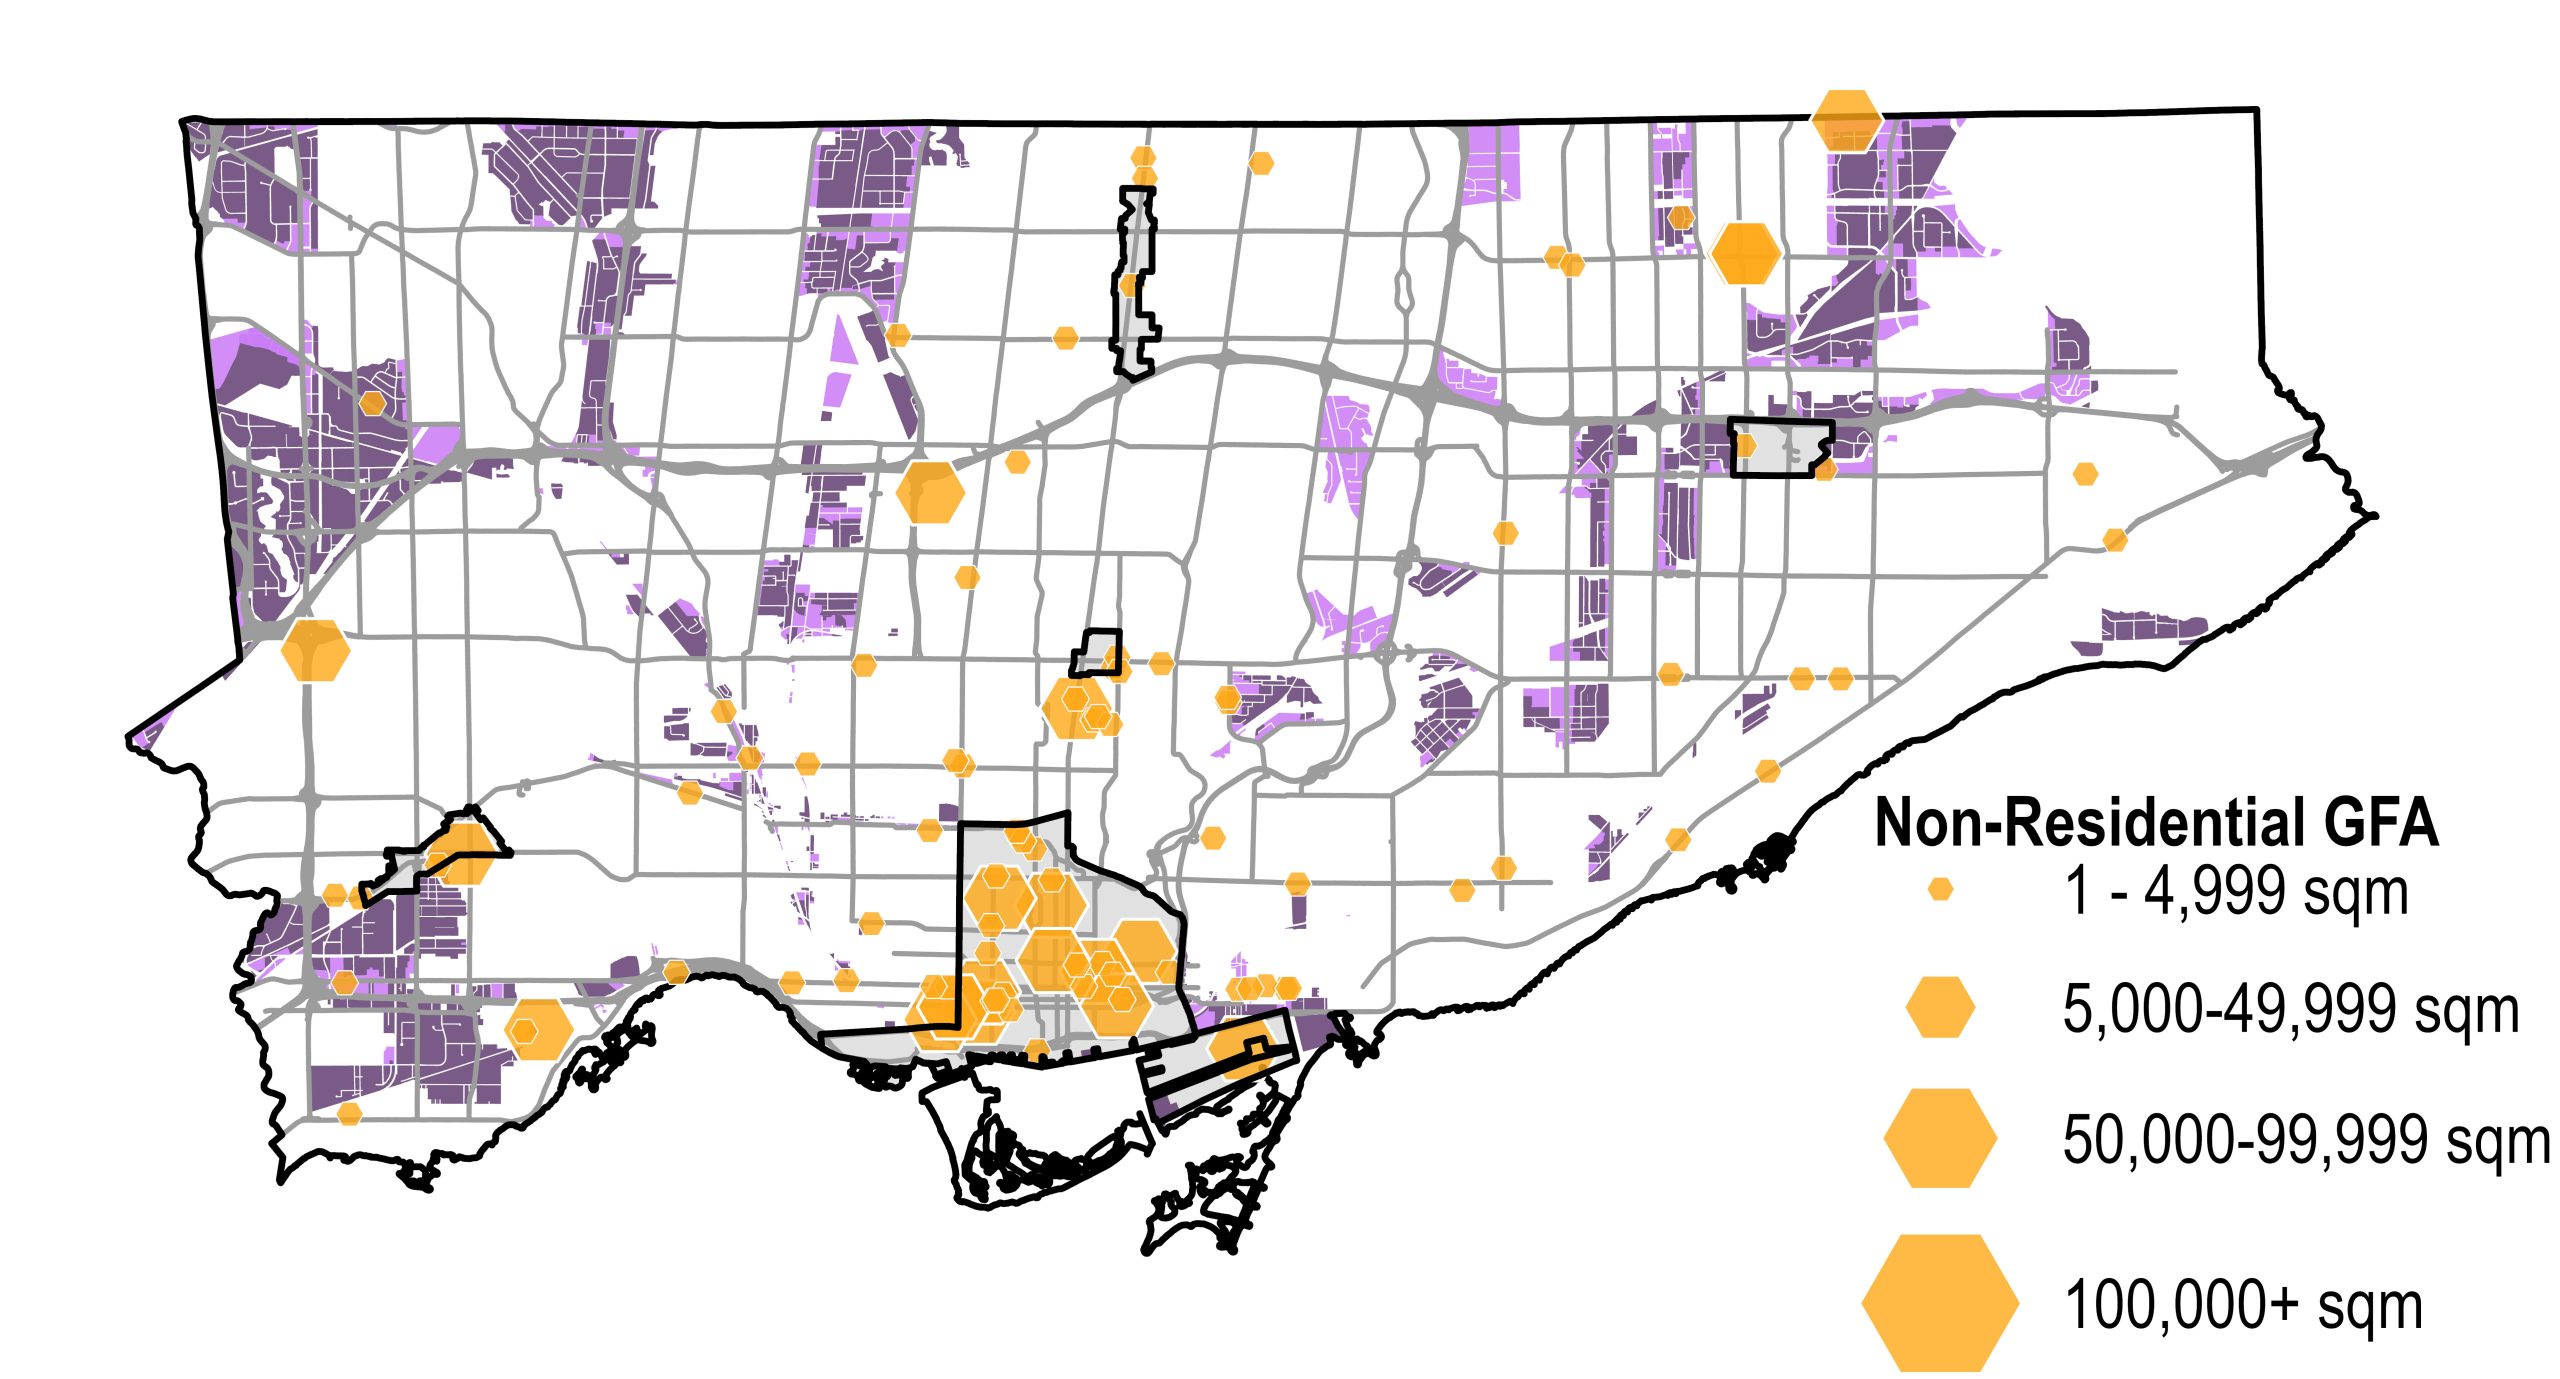
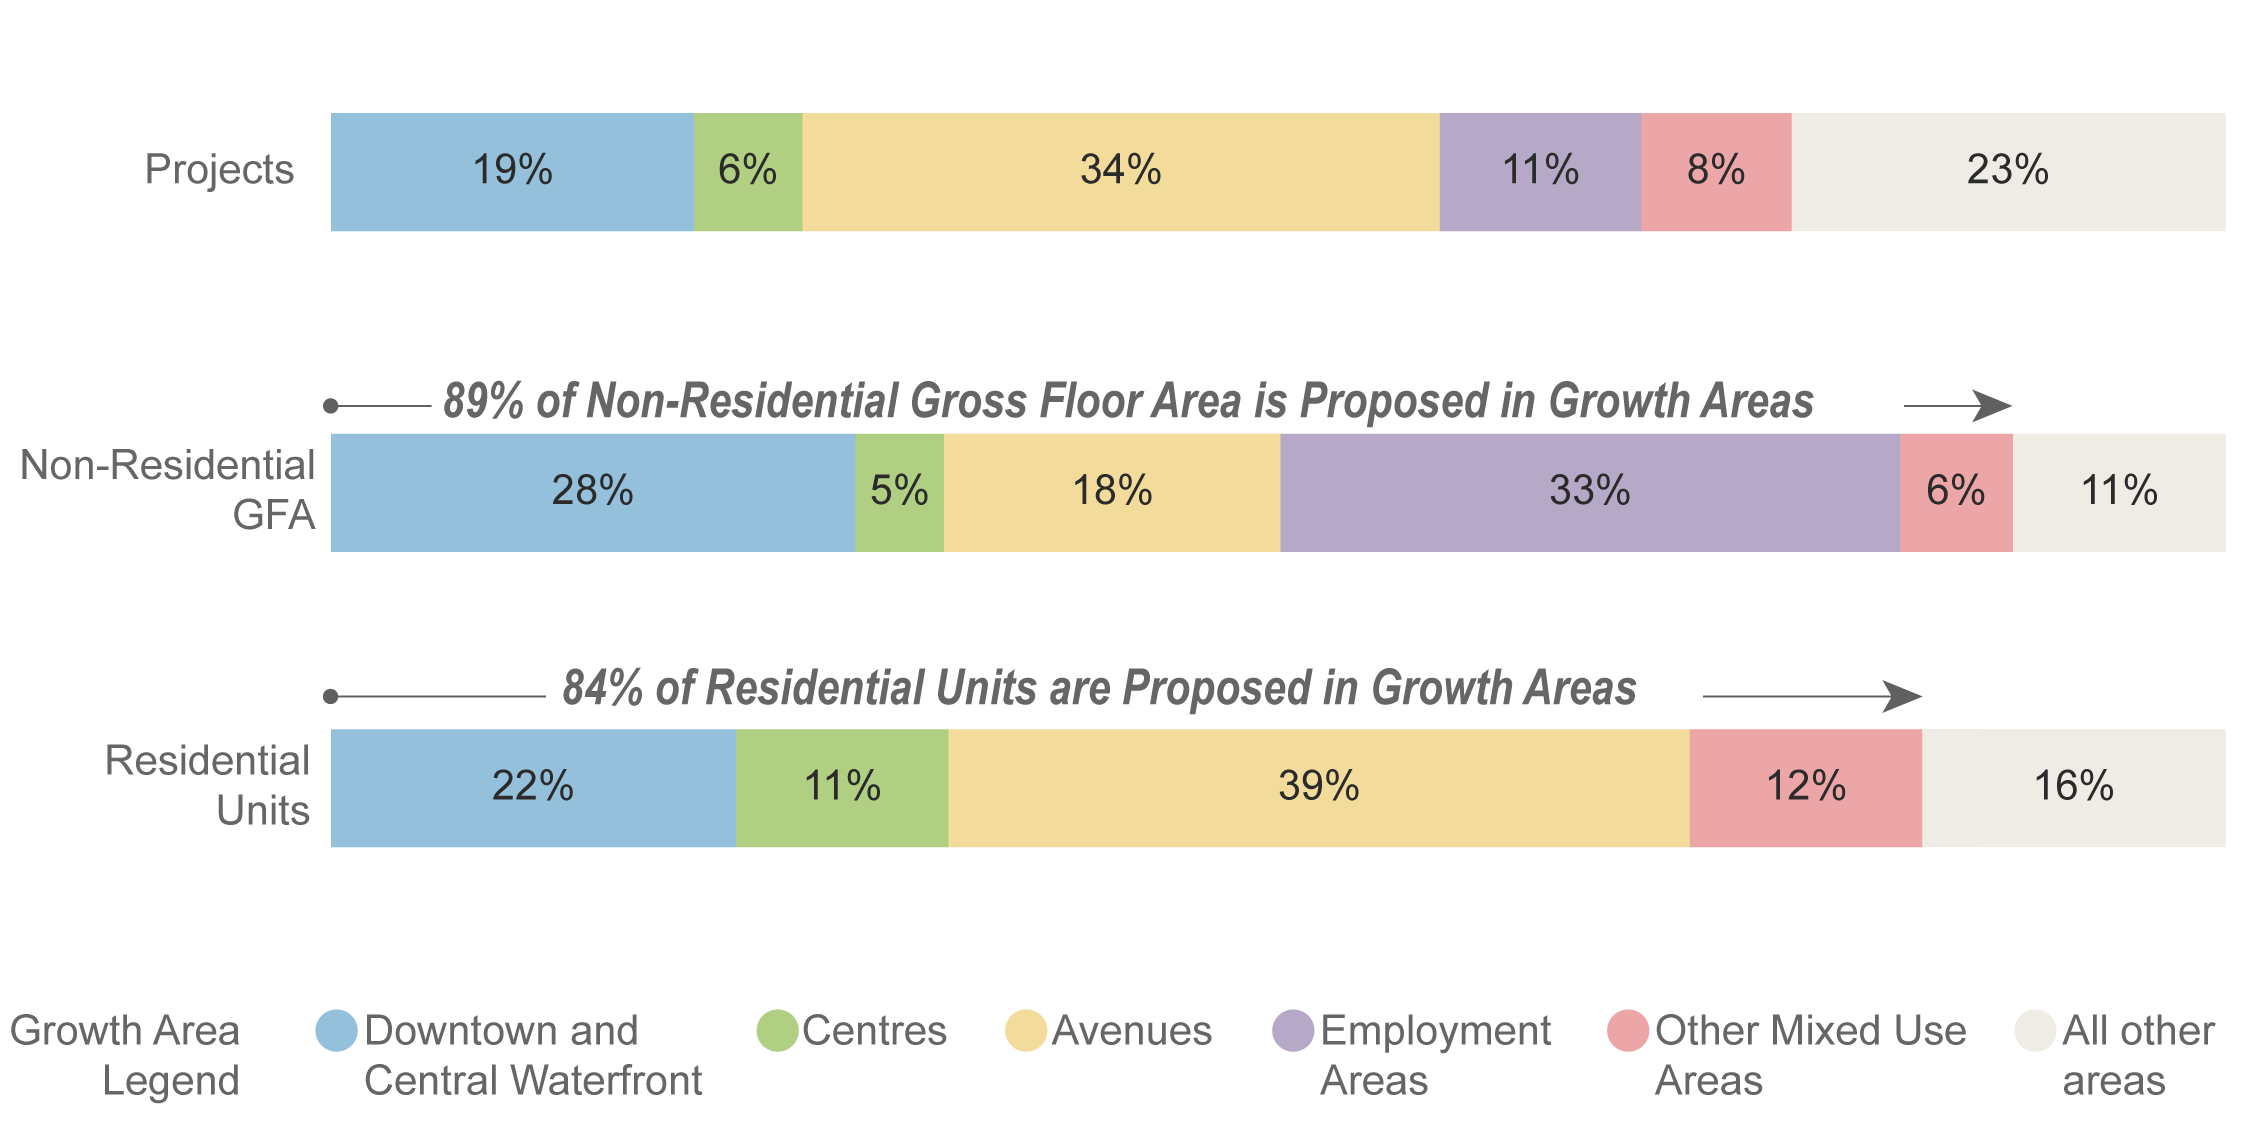
Toronto’s Official Plan came into force in June 2006 and has subsequently undergone a number of thematic amendments over time. The Official Plan is the guide for development in the city over the coming decades. Its central geographic theme is to direct growth to appropriate areas given their access to transit and other community services and facilities.
The locations recognized as being most appropriate for growth are those identified in the Official Plan’s Urban Structure Map as Avenues, Centres and the Downtown as well as other areas in the city designated as Mixed Use Areas and Employment Areas.
Most development activity continues to occur in growth areas. Eighty-four per cent of new residential development is proposed in areas currently targeted for intensification by the City’s Official Plan. Eighty-nine per cent of new non-residential development is proposed in areas targeted for intensification by the City’s Official Plan, when including Employment Areas.
* While we strive to make all content fully accessible, some materials—particularly maps, drawings, and data visualizations—may be difficult to present in fully accessible formats. If you require alternative formats or need assistance understanding this content, please contact Hailey Toft, City Planning, cityplanning@toronto.ca, 416-392-8343.
Development Pipeline 2022 Q2 and Addendum – February 2023
Development Pipeline 2021 - June 2021
Development Pipeline 2020 - October 2020
How Does the City Grow – June 2019 Part 1 and Part 2
How Does the City Grow? - Revised July 2018
How Does the City Grow? - April 2017
How Does the City Grow? - September 2016
For copies of other past bulletins available from 2011 onward, please contact Hailey Toft at City Planning by telephone at 416-392-8343 or by email at cityplanning@toronto.ca.