The Right-Sizing Housing and Generational Turnover bulletin examines housing suitability, right-sizing, turnover, and downsizing in Toronto. This bulletin estimates how much new housing stock may be needed in the future if recent trends continue, and how much additional population could be housed in older generations’ dwellings when those dwellings turn over to younger generation households.
Defining Right-Sizing, Turnover and Downsizing
Right-sizing is a household occupying a dwelling having exactly the number of bedrooms required to suitably house that household based on its size and composition, including the age, sex and relationship of its members. This bulletin examines the characteristics of right-sized households, as well as households that are underhoused (fewer bedrooms than required) and overhoused (more bedrooms than required).
Housing turnover occurs when a household vacates its dwelling and a new household moves in. Downsizing is a form of turnover. In the context of this bulletin, ‘downsizing’ is generalized to refer to households with a Primary Household Maintainer (PHM) aged 50 years or more and their transition from being “overhoused” in more bedrooms than required to one in which they occupy dwellings with fewer bedrooms.
Purpose of the Bulletin
This bulletin constitutes one of several analyses to support the ongoing implementation of the Official Plan. It will inform the Municipal Comprehensive Review of the Official Plan to bring it into conformity with A Place to Grow, the Provincial Growth Plan for the Greater Golden Horseshoe, by estimating how much new housing stock may be needed in the future if recent trends continue from a demographic perspective. While the household estimates in this bulletin incorporate the same planning horizon as the Growth Plan’s forecasts, note that these household estimates are neither forecasts nor projections and have a more limited scope.
Key Findings
- The bulletin estimates the aging of the generations, how each generation translates into households over time, and how many households there may be of each generation in the future. This in turn enables an estimate of how older generations might downsize and when, and how much of the future demand for housing this downsizing might offset. These result indicate that approximately 60% of the future increase in demand for housing can be fulfilled by the turnover of older generations’ housing.
- The demand for apartments, units with up to two bedrooms, and owned units would be fulfilled by a combination of turnover plus new supply, assuming that historic completion levels remained stable. In contrast, future demand would not be fulfilled for single- or semi-detached houses, units with three or more bedrooms, or purpose-built rental units.
- The bulletin also finds that there are a significant number of existing dwellings occupied by older households and, because these households are at a later point in their lifecycle, the dwellings are not presently occupied to their fullest capacity. These dwellings could potentially accommodate more population if that stock turned over to younger and larger household. The capacity for an additional 16.1% persons within older generations’ housing stock could be realized (compared to 2016 population). By 2051, it is estimated that almost all of the housing occupied by older generation households in 2016 will have turned over.
Housing Suitability Highlights
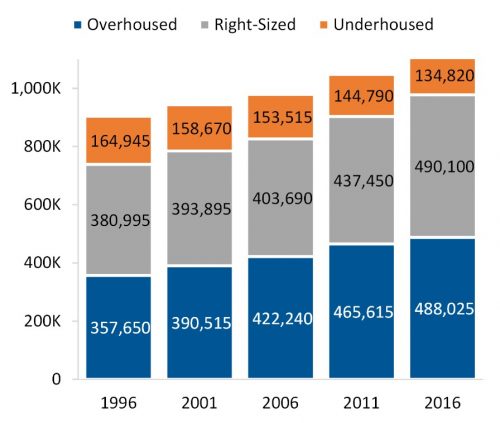
- In 2016, almost 135,000 Toronto households were underhoused while more than three times as many households were overhoused (488,025).
- Between 1996 and 2016, the number of overhoused households increased significantly (by 130,375 households or 36.5%), while underhoused households declined at a comparatively moderate rate (by 30,125 households or 18.3%). The increase in overhoused households has outpaced total household growth (23.2%).
- The percent share of right-sized households decreases steadily with age, from 62.9% for households aged 15-34 to 30.4% for households aged 70 and over in 2016. The rate of overhousing increases with the age of the household, from 24.3% for households aged 15-34 to 66.0% for households aged 70 and over in 2016. Households also move less as they age.
- The underhousing rate for renters was almost three times as high as for owners (18.6% versus 6.3%). Nearly 100,000 (97,815) renter households were underhoused in 2016 compared with 37,010 underhoused owner households. In 2016, approximately two thirds (66.2%) of owner households were overhoused, compared to a little less than one fifth (18.9%) of renter households.
- Households with children collectively have lower rates of overhousing, and higher rates of underhousing than households without children. Two in ten couple family with children households and three in ten lone-parent households were underhoused in 2016 (59,675 and 40,185 households respectively).
- Underhousing rates are higher when the number of children in a family are higher, with almost half of all family households with three or more children being underhoused in 2016 (equating to 40,705 households). The underhousing rates for lone-parent households with three or more children (62.4%) are significantly higher than for couple family with children households (47.6).
- In 2016, 17.2% of all mid/high-rise households were underhoused compared to 7.6% of households living in houses and low-rises. The rate of overhousing was higher for houses and low-rises (61.1%) and row/townhouses (57.8%) compared with 22.6% for mid/high-rises.
- In 2016, approximately two-thirds (65.4%) of all underhoused households with children resided in mid/high-rise dwellings, amounting to 65,310 households.
- Underhousing and overhousing are a choice for some households rather than a necessity. However, 49,655 households, about a third of all underhoused households, are experiencing affordability issues as well as underhousing. Affordability-related underhousing is more prevalent among younger households.
- The City is undertaking several initiatives that may help address involuntary underhousing and overhousing by increasing the housing and affordable housing supply, and encouraging households to right-size. These initiatives include the HousingTO 2020-2030 Action Plan, new Secondary Plans that require two-or-more-bedroom units in new developments, the Growing Up: Planning for Children in New Vertical Communities Urban Design Guidelines, the Expanding Housing Options in Neighbourhoods initiative, the proposed Inclusionary Zoning policy, the existing Official Plan permission to build secondary suites and laneway suites, the regulation of short-term rentals, and the establishment a new Vacant Home Tax.
Housing Turnover Highlights
- The current trend suggests that the Baby Boomers appear to be following the same downsizing trajectory as the Silent Generation as of 2016. The Baby Boomers moved within Toronto and into mid/high-rise units at about the same rates as the Silent Generation did at the same ages.
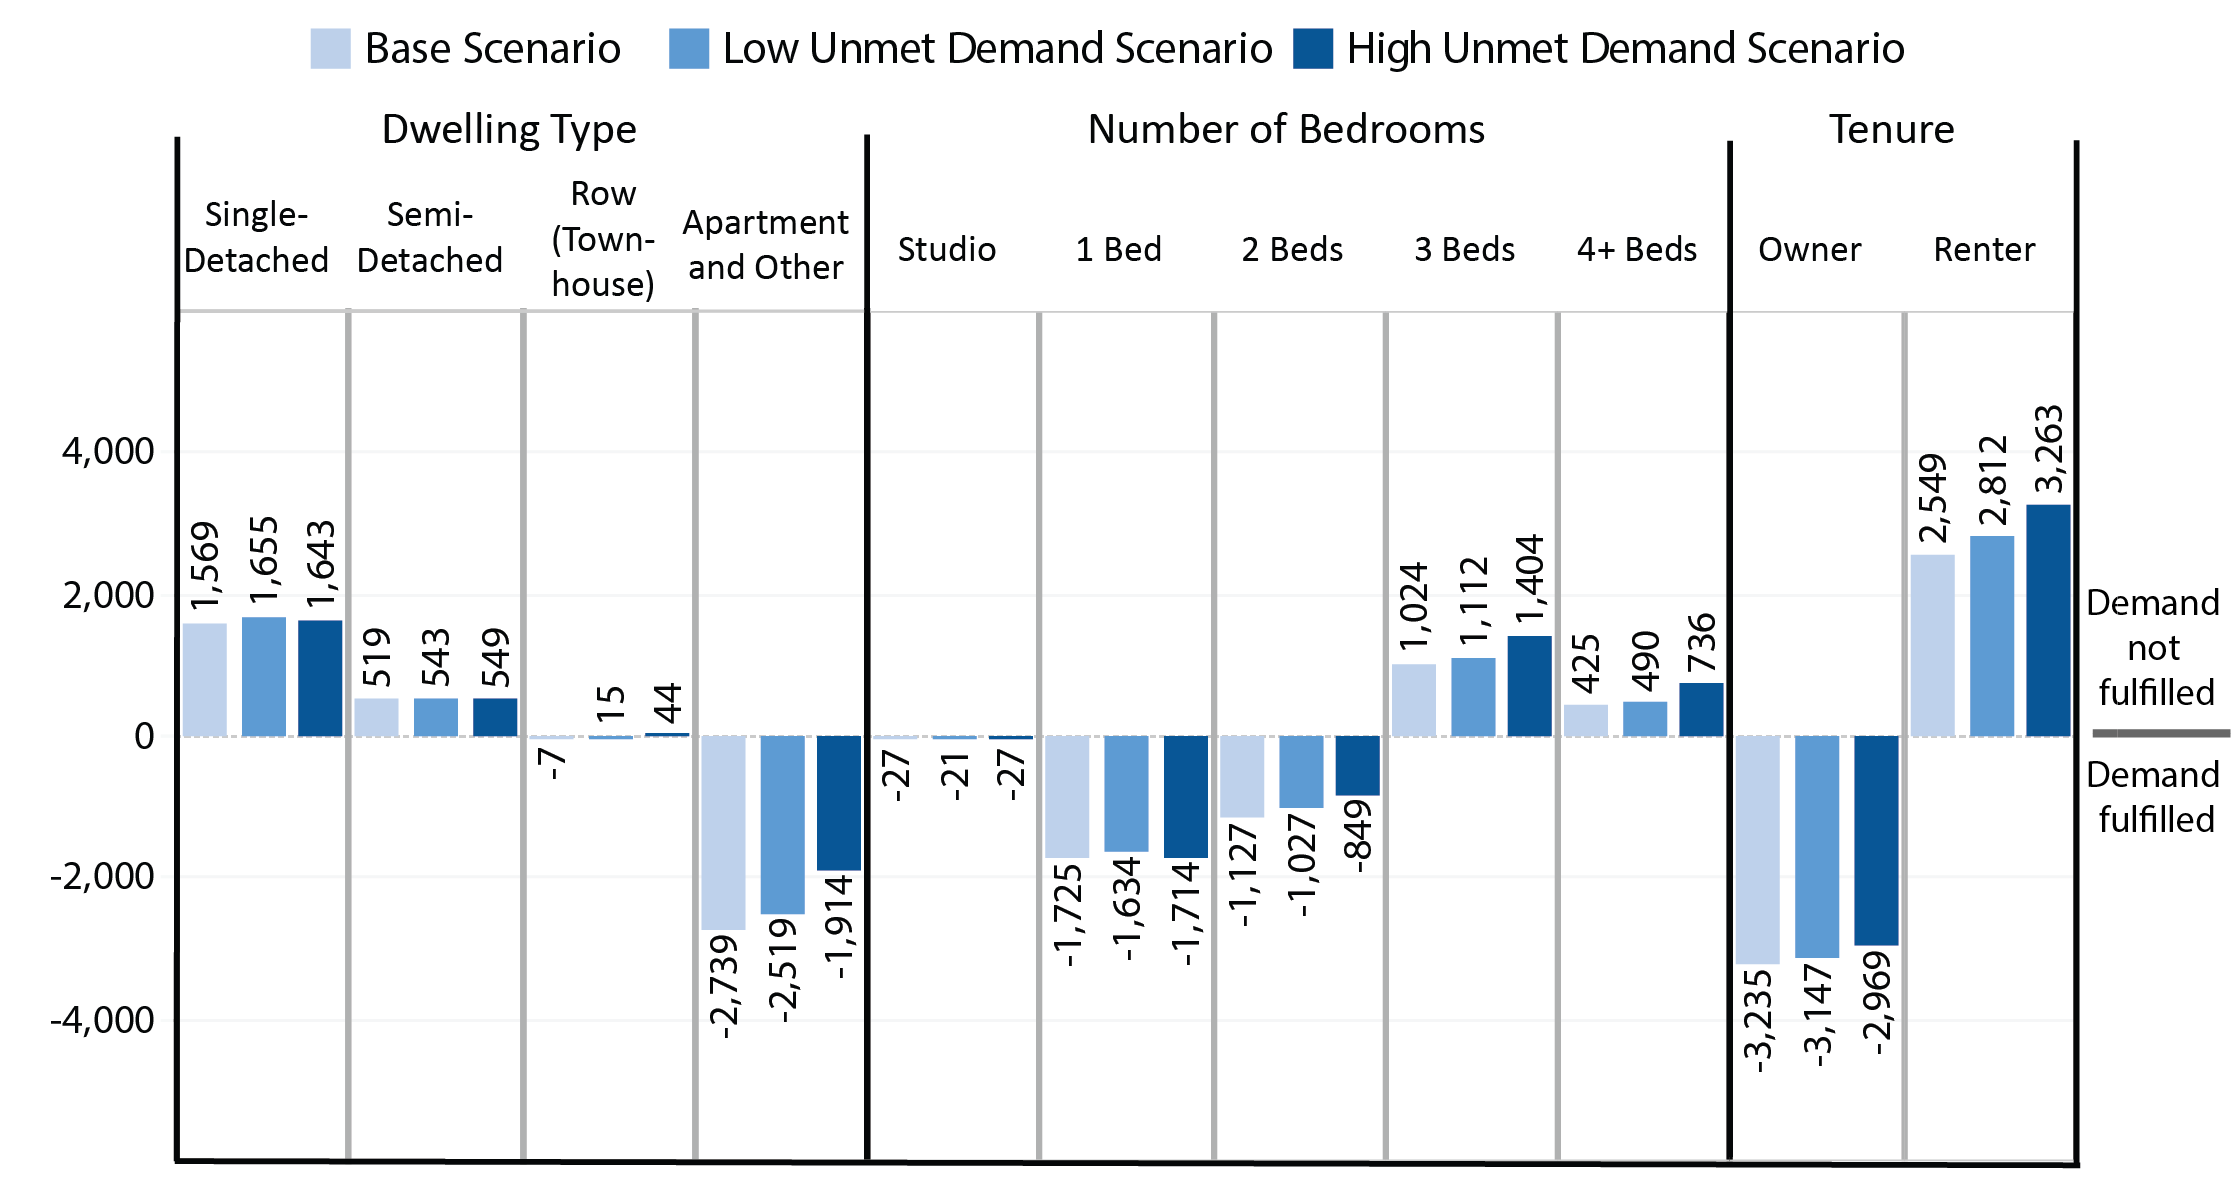
- Three scenarios of future household estimates to 2051 were calculated, a Base Scenario that employs current occupancy rates, a Low Unmet Demand Scenario that incorporates additional demands to suitably accommodate households that are involuntarily underhoused, and a High Unmet Demand Scenario that incorporates additional demands to suitably accommodate all underhoused households. In all three scenarios, about 60% of the overall estimated future increase in demand for housing could be fulfilled by older generations’ housing turnover.
- In all three scenarios, the demand for apartments, units with up to two bedrooms, and owned units would be fulfilled by a combination of turnover plus new supply, assuming that historic completion levels remained stable. In contrast, future demand would not be fulfilled for single- or semi-detached houses, units with three or more bedrooms, or purpose-built rental units.
- By 2051, it is estimated that almost all of the 2016 housing occupied by older generation households will have turned over and that the capacity for an additional 207,240 persons within older generations’ housing stock could be realized.
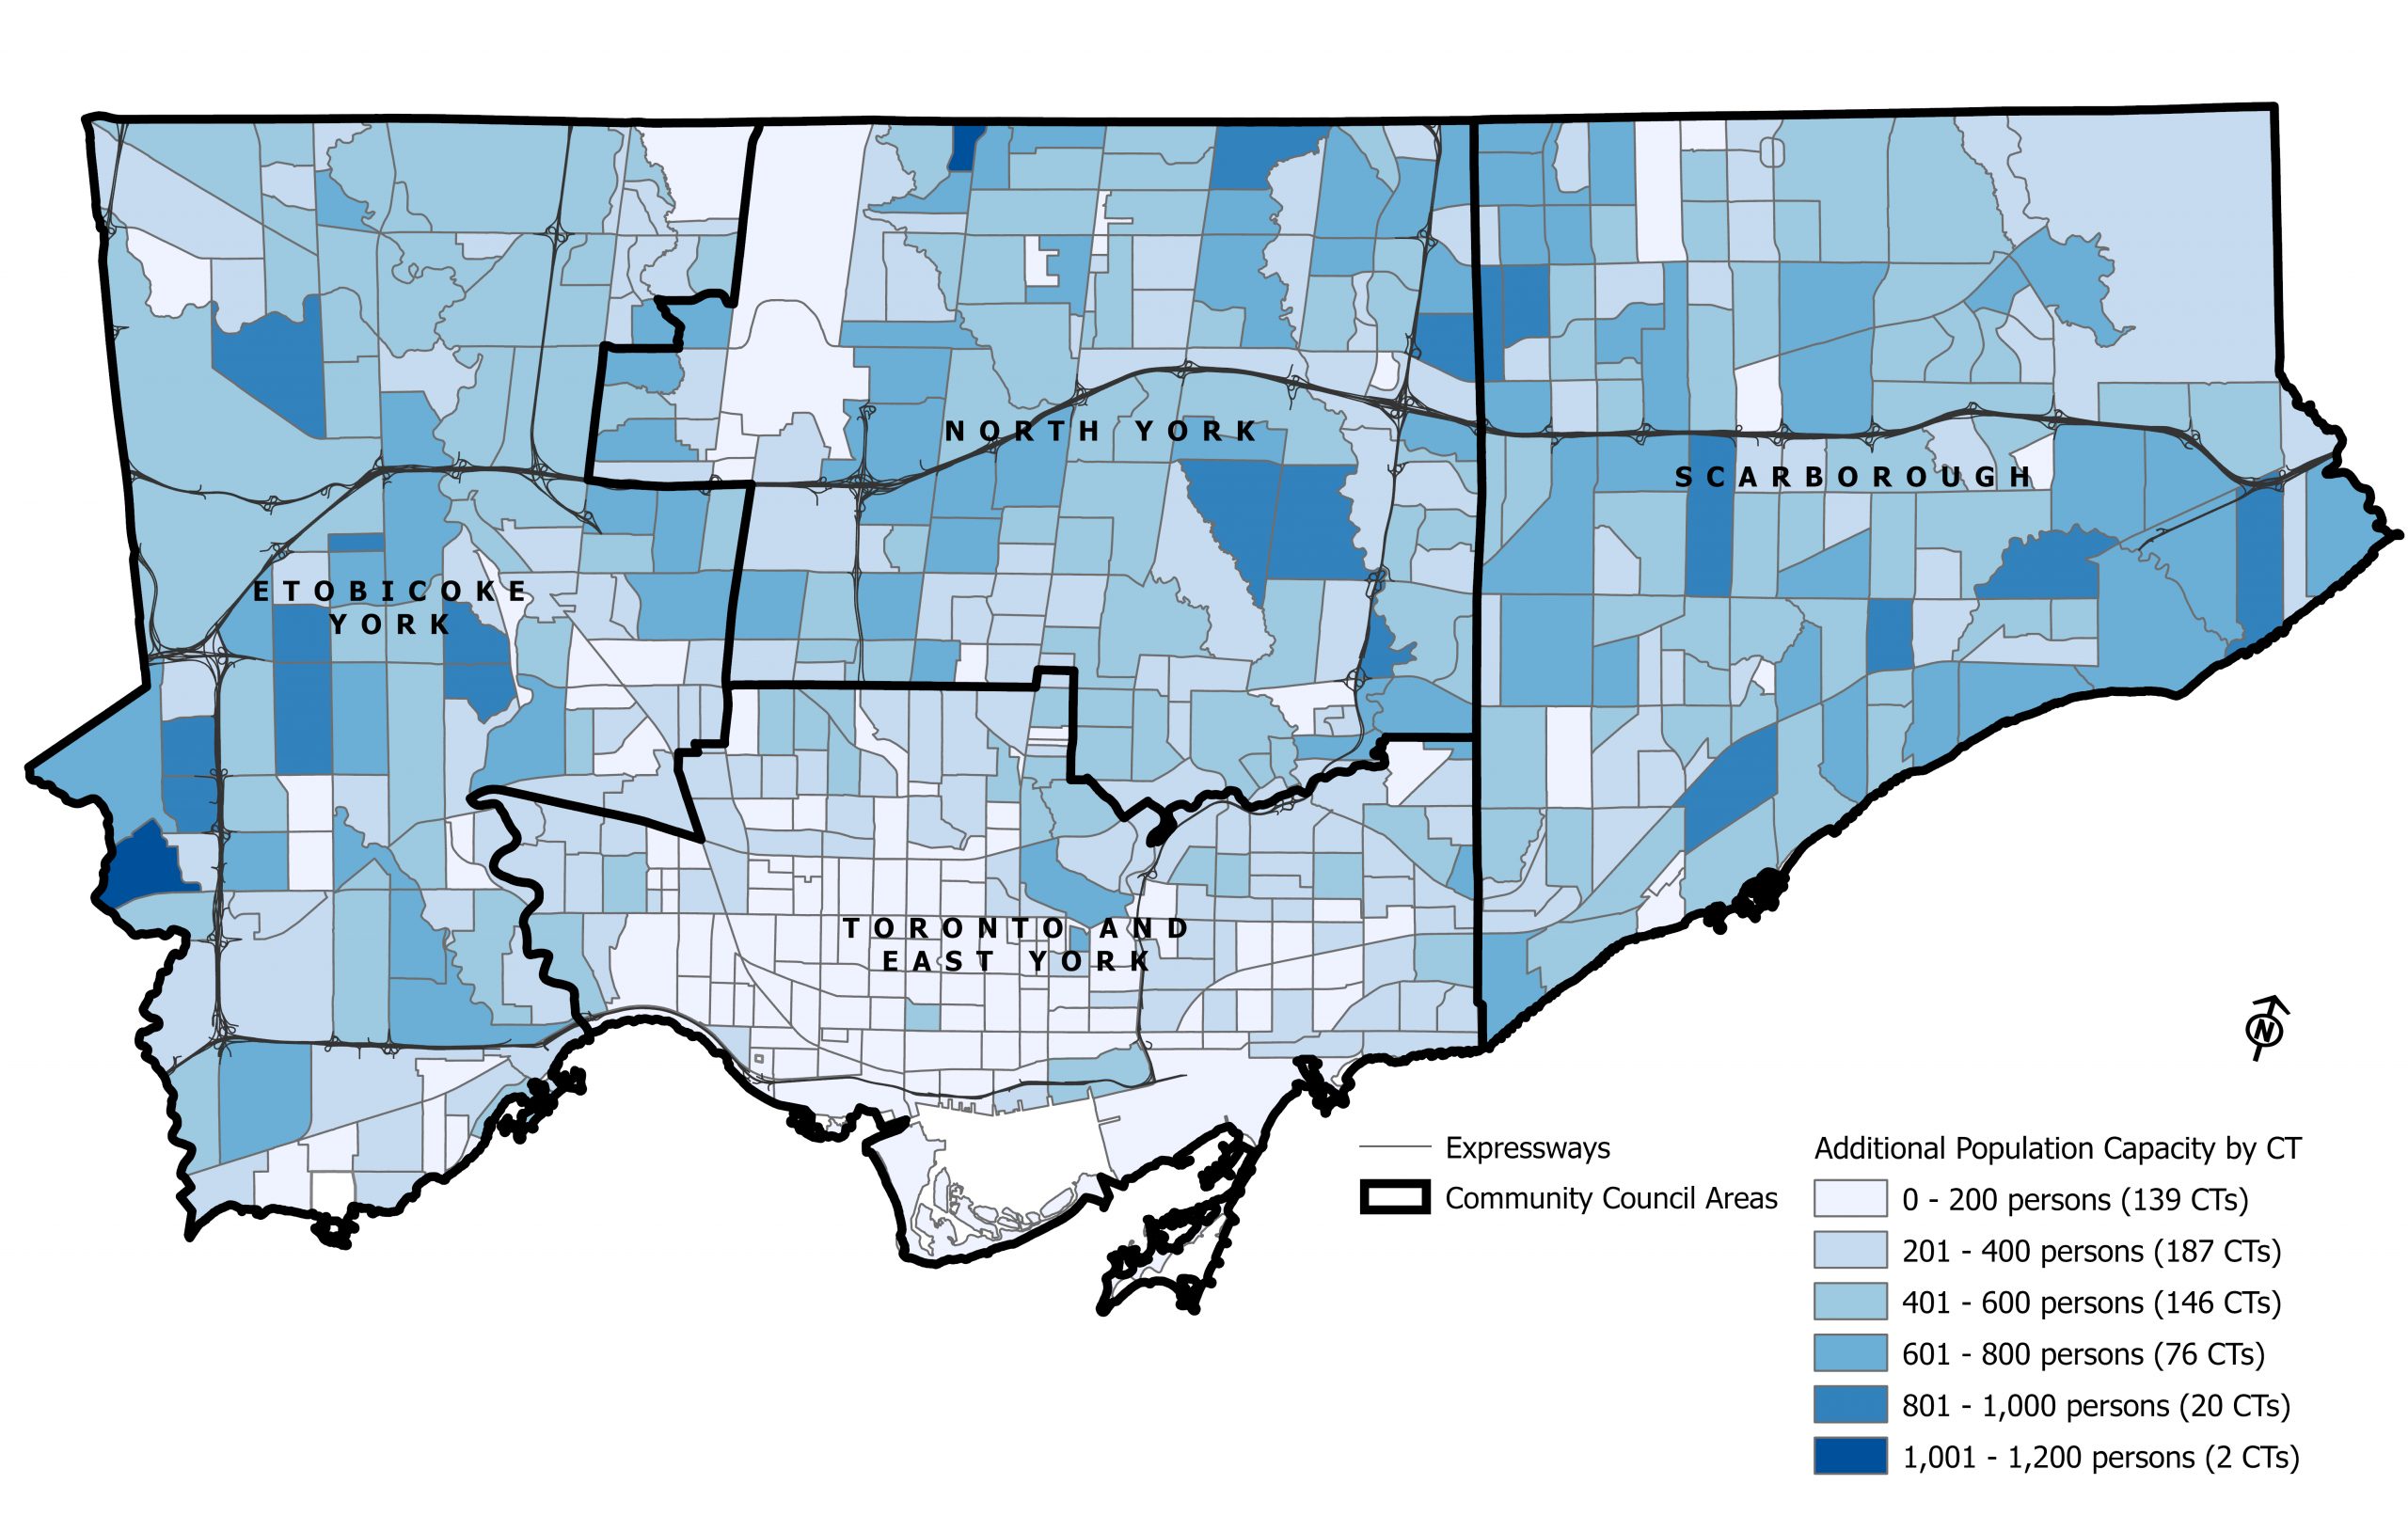
- The areas within the city that have the greatest opportunity to accommodate additional population in the existing housing stock are found in Etobicoke York, North York and Scarborough Community Council areas.
- Approximately 25% of Toronto’s forecasted population growth to 2051 could be accommodated in the existing housing stock as a result of housing turnover and the utilization of currently unused population capacity.
Date modified: February 13, 2026