The 2026 Employment Survey is now live. All responses will be kept confidential.
Since 1983, Toronto has monitored the City’s employment by conducting an annual survey of businesses. The data collected is vital to monitor the City’s economic health, as well as aiding in decision and policy making. It is essential background information for forecasting and planning the City’s infrastructure and services for the citizens and businesses of Toronto. The Survey is a unique resource in Canada for the private and public sectors.
For more information on the 2025 Survey Results, see the Toronto Employment Survey 2025 Summary for highlights and the full 2025 Toronto Employment Survey Bulletin for detailed findings and appendices. Please note that the Bulletin was revised in December 2025. Please use the version on this website rather than the one posted on the Planning and Housing Committee Agenda Item. Selected highlights from the 2025 Survey can also found below.
How the Survey Works
Throughout the summer, surveyors visit each and every business establishment in the City of Toronto. That’s 74,560 establishments visited this summer! The surveyors collect information about the number of employees working there, and the type of work that is taking place. No other programme relates Toronto employment and land use.
Your Information is Confidential
The information collected is treated as strictly confidential. The data is only released to the public in aggregate form. This allows employment patterns to be studied without revealing specific information on individual businesses.
We Need You
The continued success of this important survey depends on the co-operation and assistance of the City’s business community. We rely on each business establishment to provide us with information on the number of full- and part-time employees as well as the type of employment activity taking place at each location.
Watch out for a surveyor at your business this summer and count your business in!
2025 Survey Results
The 2025 Employment Bulletin summarizes the results of the 43rd annual Toronto Employment Survey and provides an analysis of changes in Toronto’s economy over the past decade. The bulletin reports on key employment trends by sector, and on evolving employment patterns across the city and in Downtown, the Districts, Centres, Secondary Plan areas, Employment Areas, and Areas of Employment.
Toronto Employment Concentration, 2025
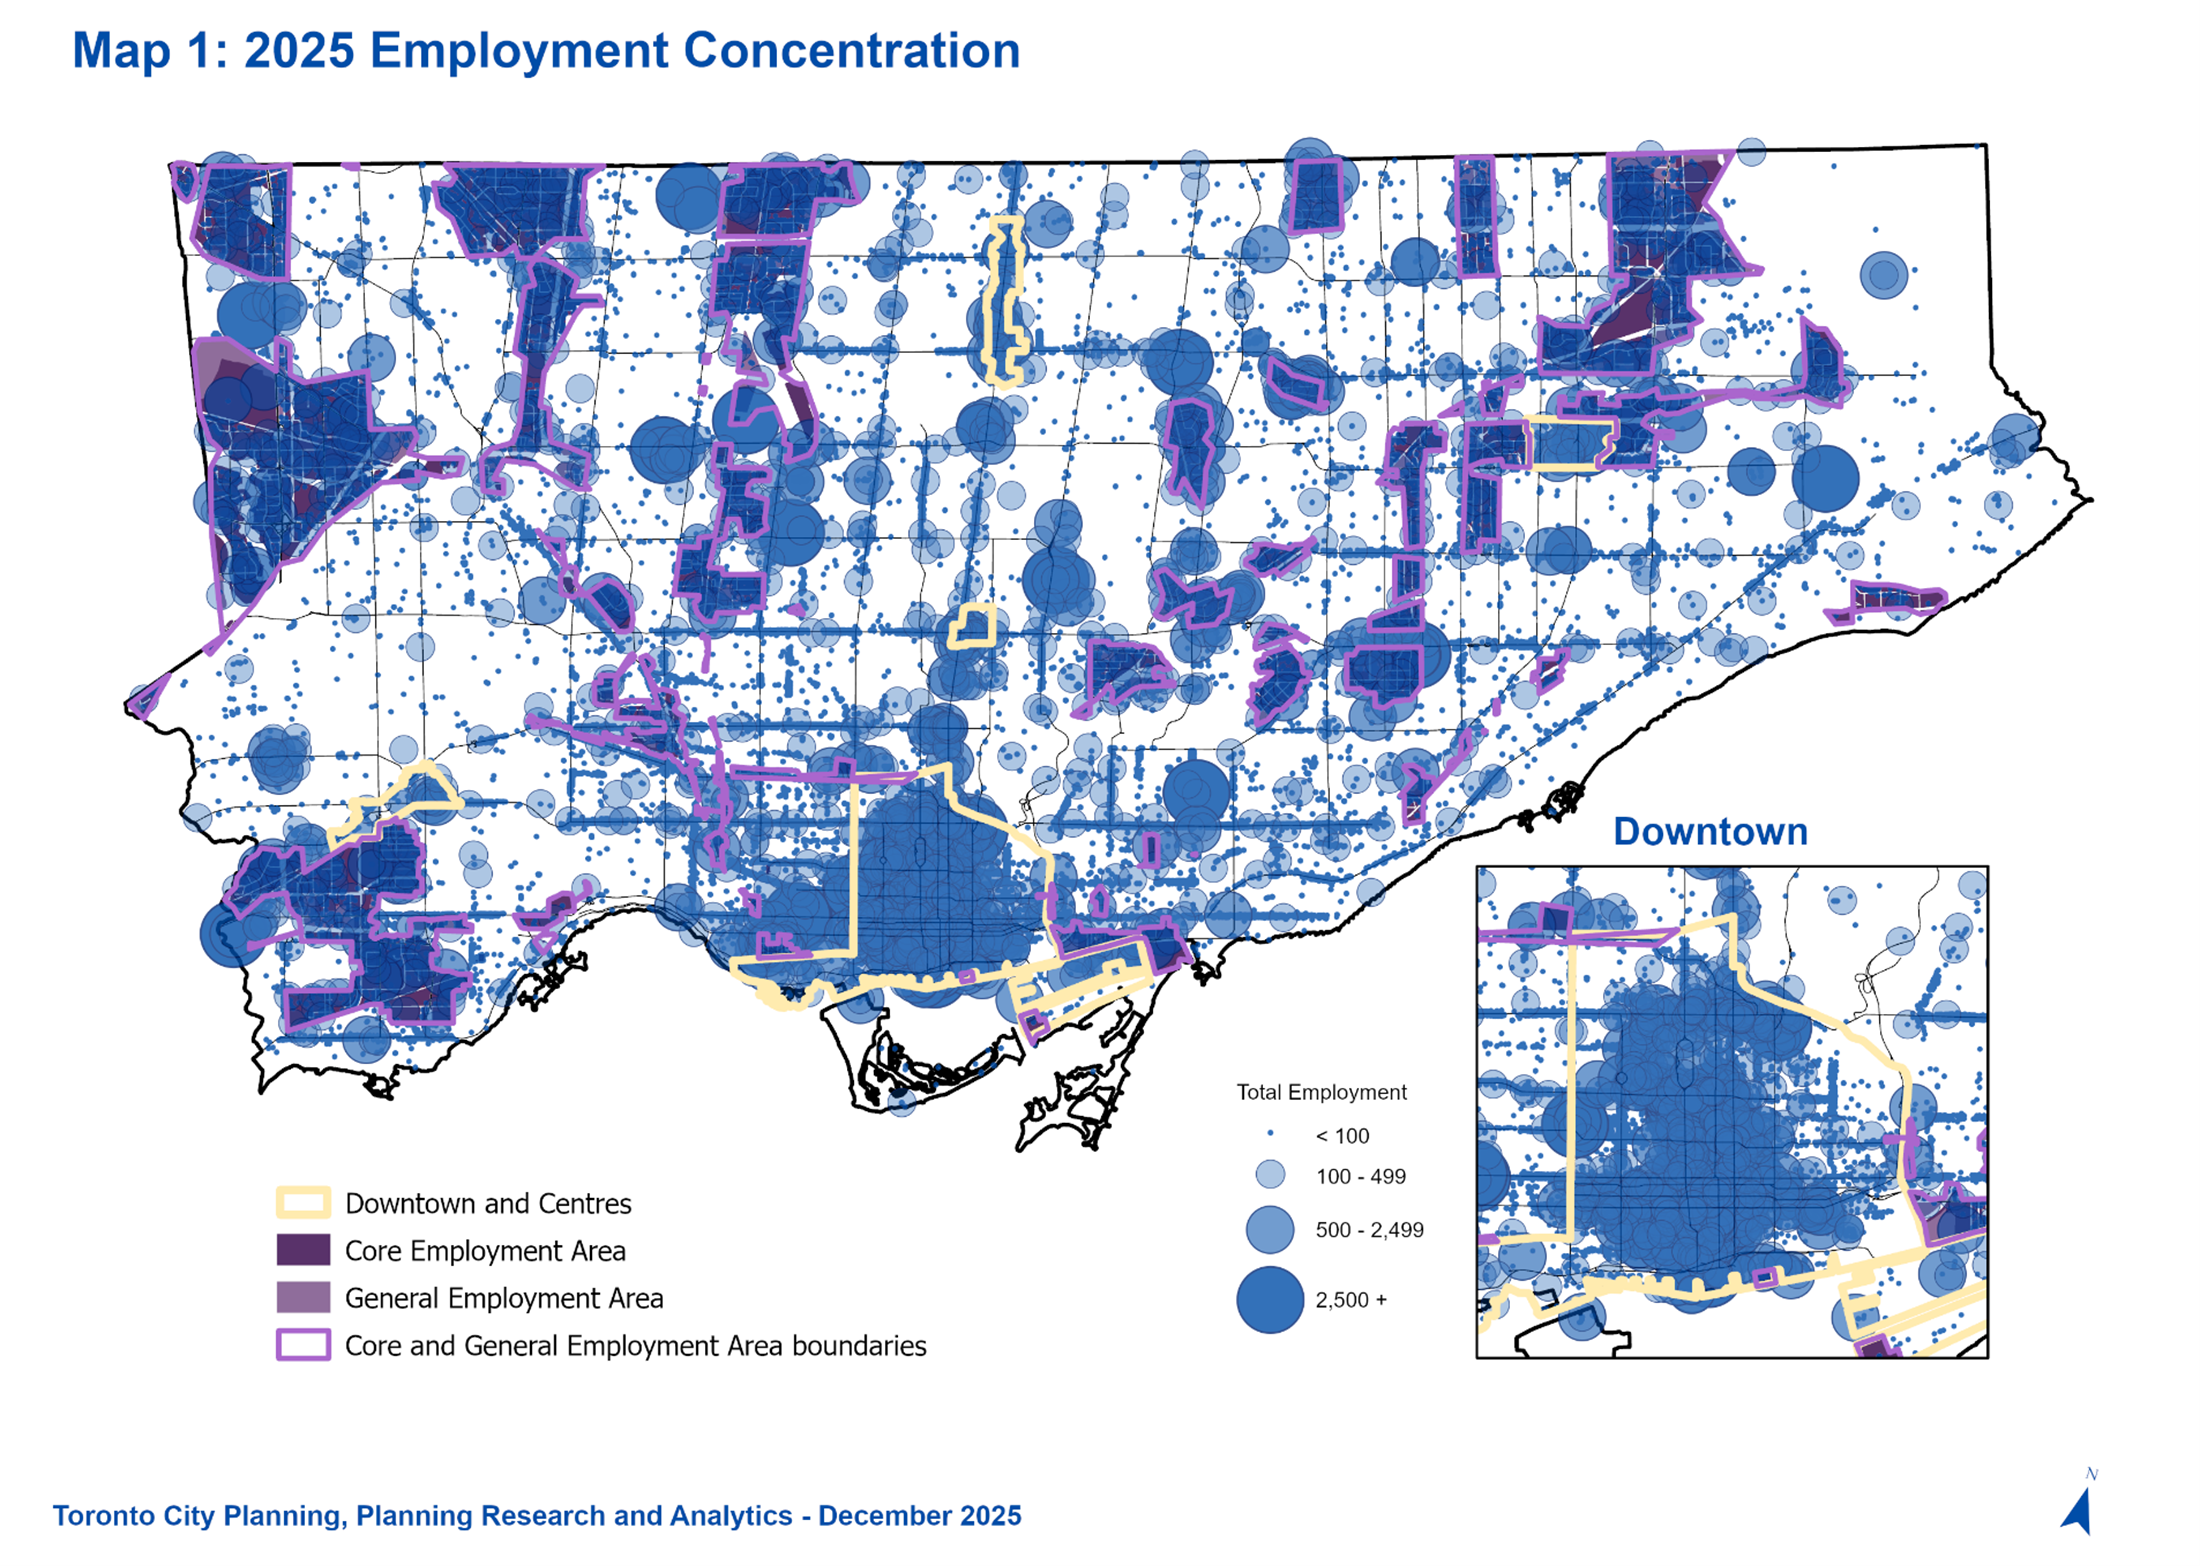
Highlights
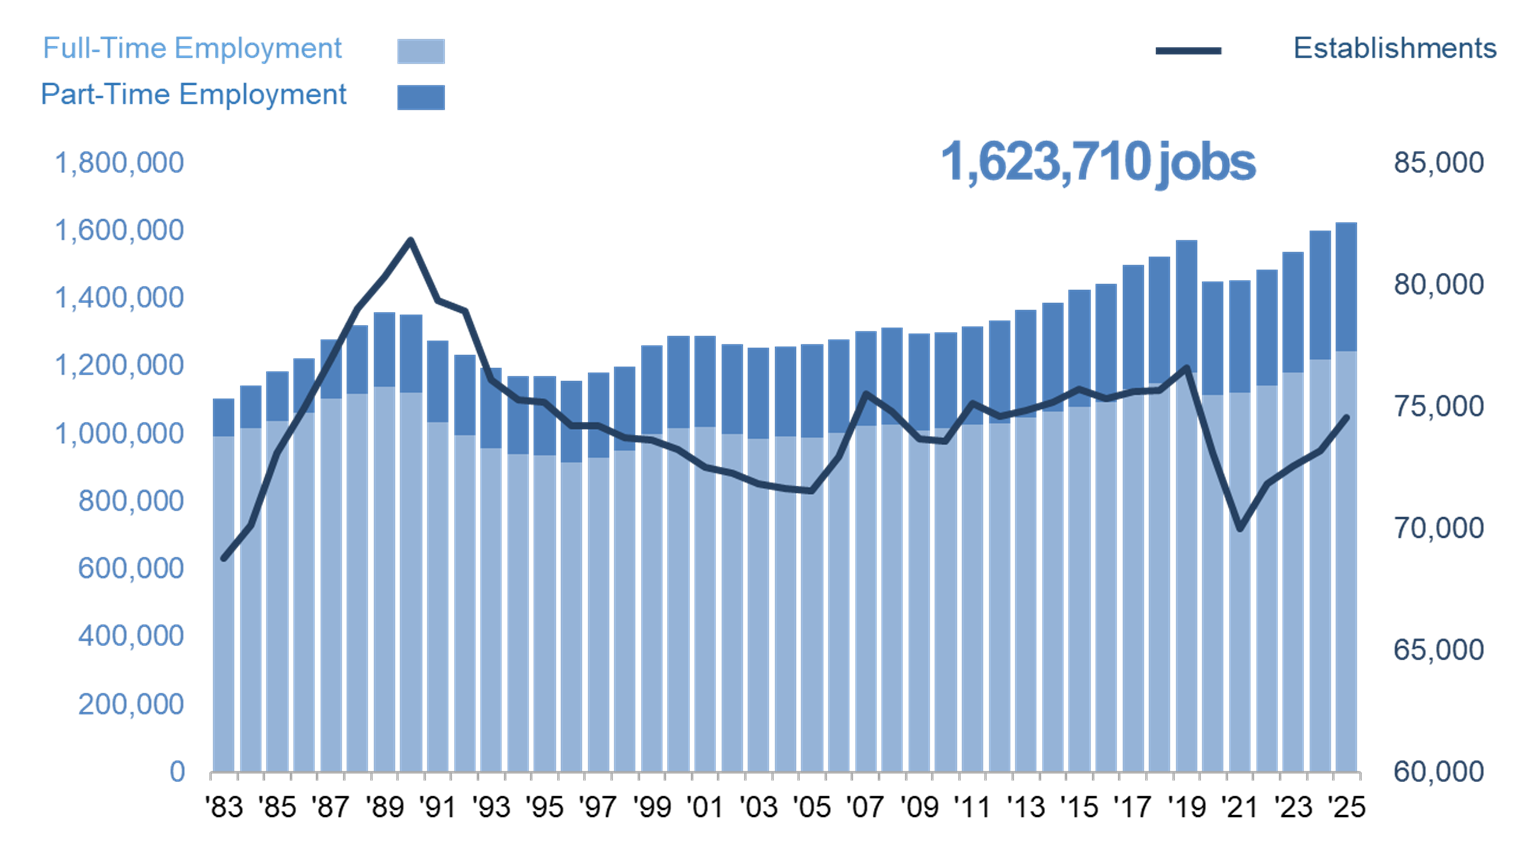
- The Toronto Employment Survey counted 1,623,720 jobs in 2025, marking a new record high.
- In 2025, the Toronto Employment Survey recorded a 1.5 per cent increase in total jobs, up 23,410 jobs.
- Full-time employment increased by 24,940 jobs or 2.0 per cent from 2024 to 1,243,620 jobs.
- Part-time employment decreased by 1,530 jobs or 0.4 per cent from 2024 to 380,090 jobs.
- In 2025, the Survey counted 74,560 establishments, a net increase of 1,380 or 1.9 per cent.
- A total of 5,160 establishments were new to the city in 2025. Of these, 1,550 are located in Employment Areas (30.1 per cent), 1,190 in Downtown (23.1 per cent), 290 in the Centres (5.6 per cent), and 2,120 (41.2 per cent) in the rest of the city.
- The Office category continues to make up the largest share of Toronto employment, with 50.1 per cent of jobs, up from 47.9 per cent a decade ago.
- The majority of jobs are located in Toronto and East York District (53.4 per cent), followed by North York (19.2 per cent), Etobicoke York (15.4 per cent) and Scarborough (12.0 per cent).
- There were 664,650 jobs in Toronto’s Downtown in 2025, the highest employment count reported in the last five years.
- The four Centres had 77,460 jobs in 2025, 4.8 per cent of the city’s total employment. There was an increase of 1.5 per cent in employment in the City’s four centres since 2024.
- Employment Areas contained 381,270 jobs, 23.5 per cent of the city total. This is down 6,490 jobs or 1.7 per cent from last year. This continues a trend occurring since 2022. Employment Areas contain 16,810 fewer jobs than in 2022.
- Secondary Plan areas account for 926,900 jobs or 57.1 per cent of all citywide employment, a 1.1 per cent increase from last year.
- Areas of Employment accounted for 412,090 jobs, or 25.4 per cent of all citywide employment.
Total Employment in City of Toronto, 1983-2025
Total Employment – 2016, 2024, 2025
| Employment |
Total Number of Employees |
Net Change |
Percent Change |
Net Change |
Percent Change |
|
2016 |
2024 |
2025 |
2016-2025 |
2024-2025 |
| Full-time |
1,092,700 |
1,218,680 |
1,243,620 |
150,920 |
13.8% |
24,940 |
2.0% |
| Part-time |
348,090 |
381,620 |
380,090 |
32,000 |
9.2% |
-1,530 |
-0.4% |
| Total |
1,440,790 |
1,600,300 |
1,623,710 |
182,920 |
12.7% |
23,410 |
1.5% |
Source:City of Toronto, City Planning, Planning Research and Analytics
Note: Numbers have been rounded to the nearest ten. Totals and sums may differ due to rounding.
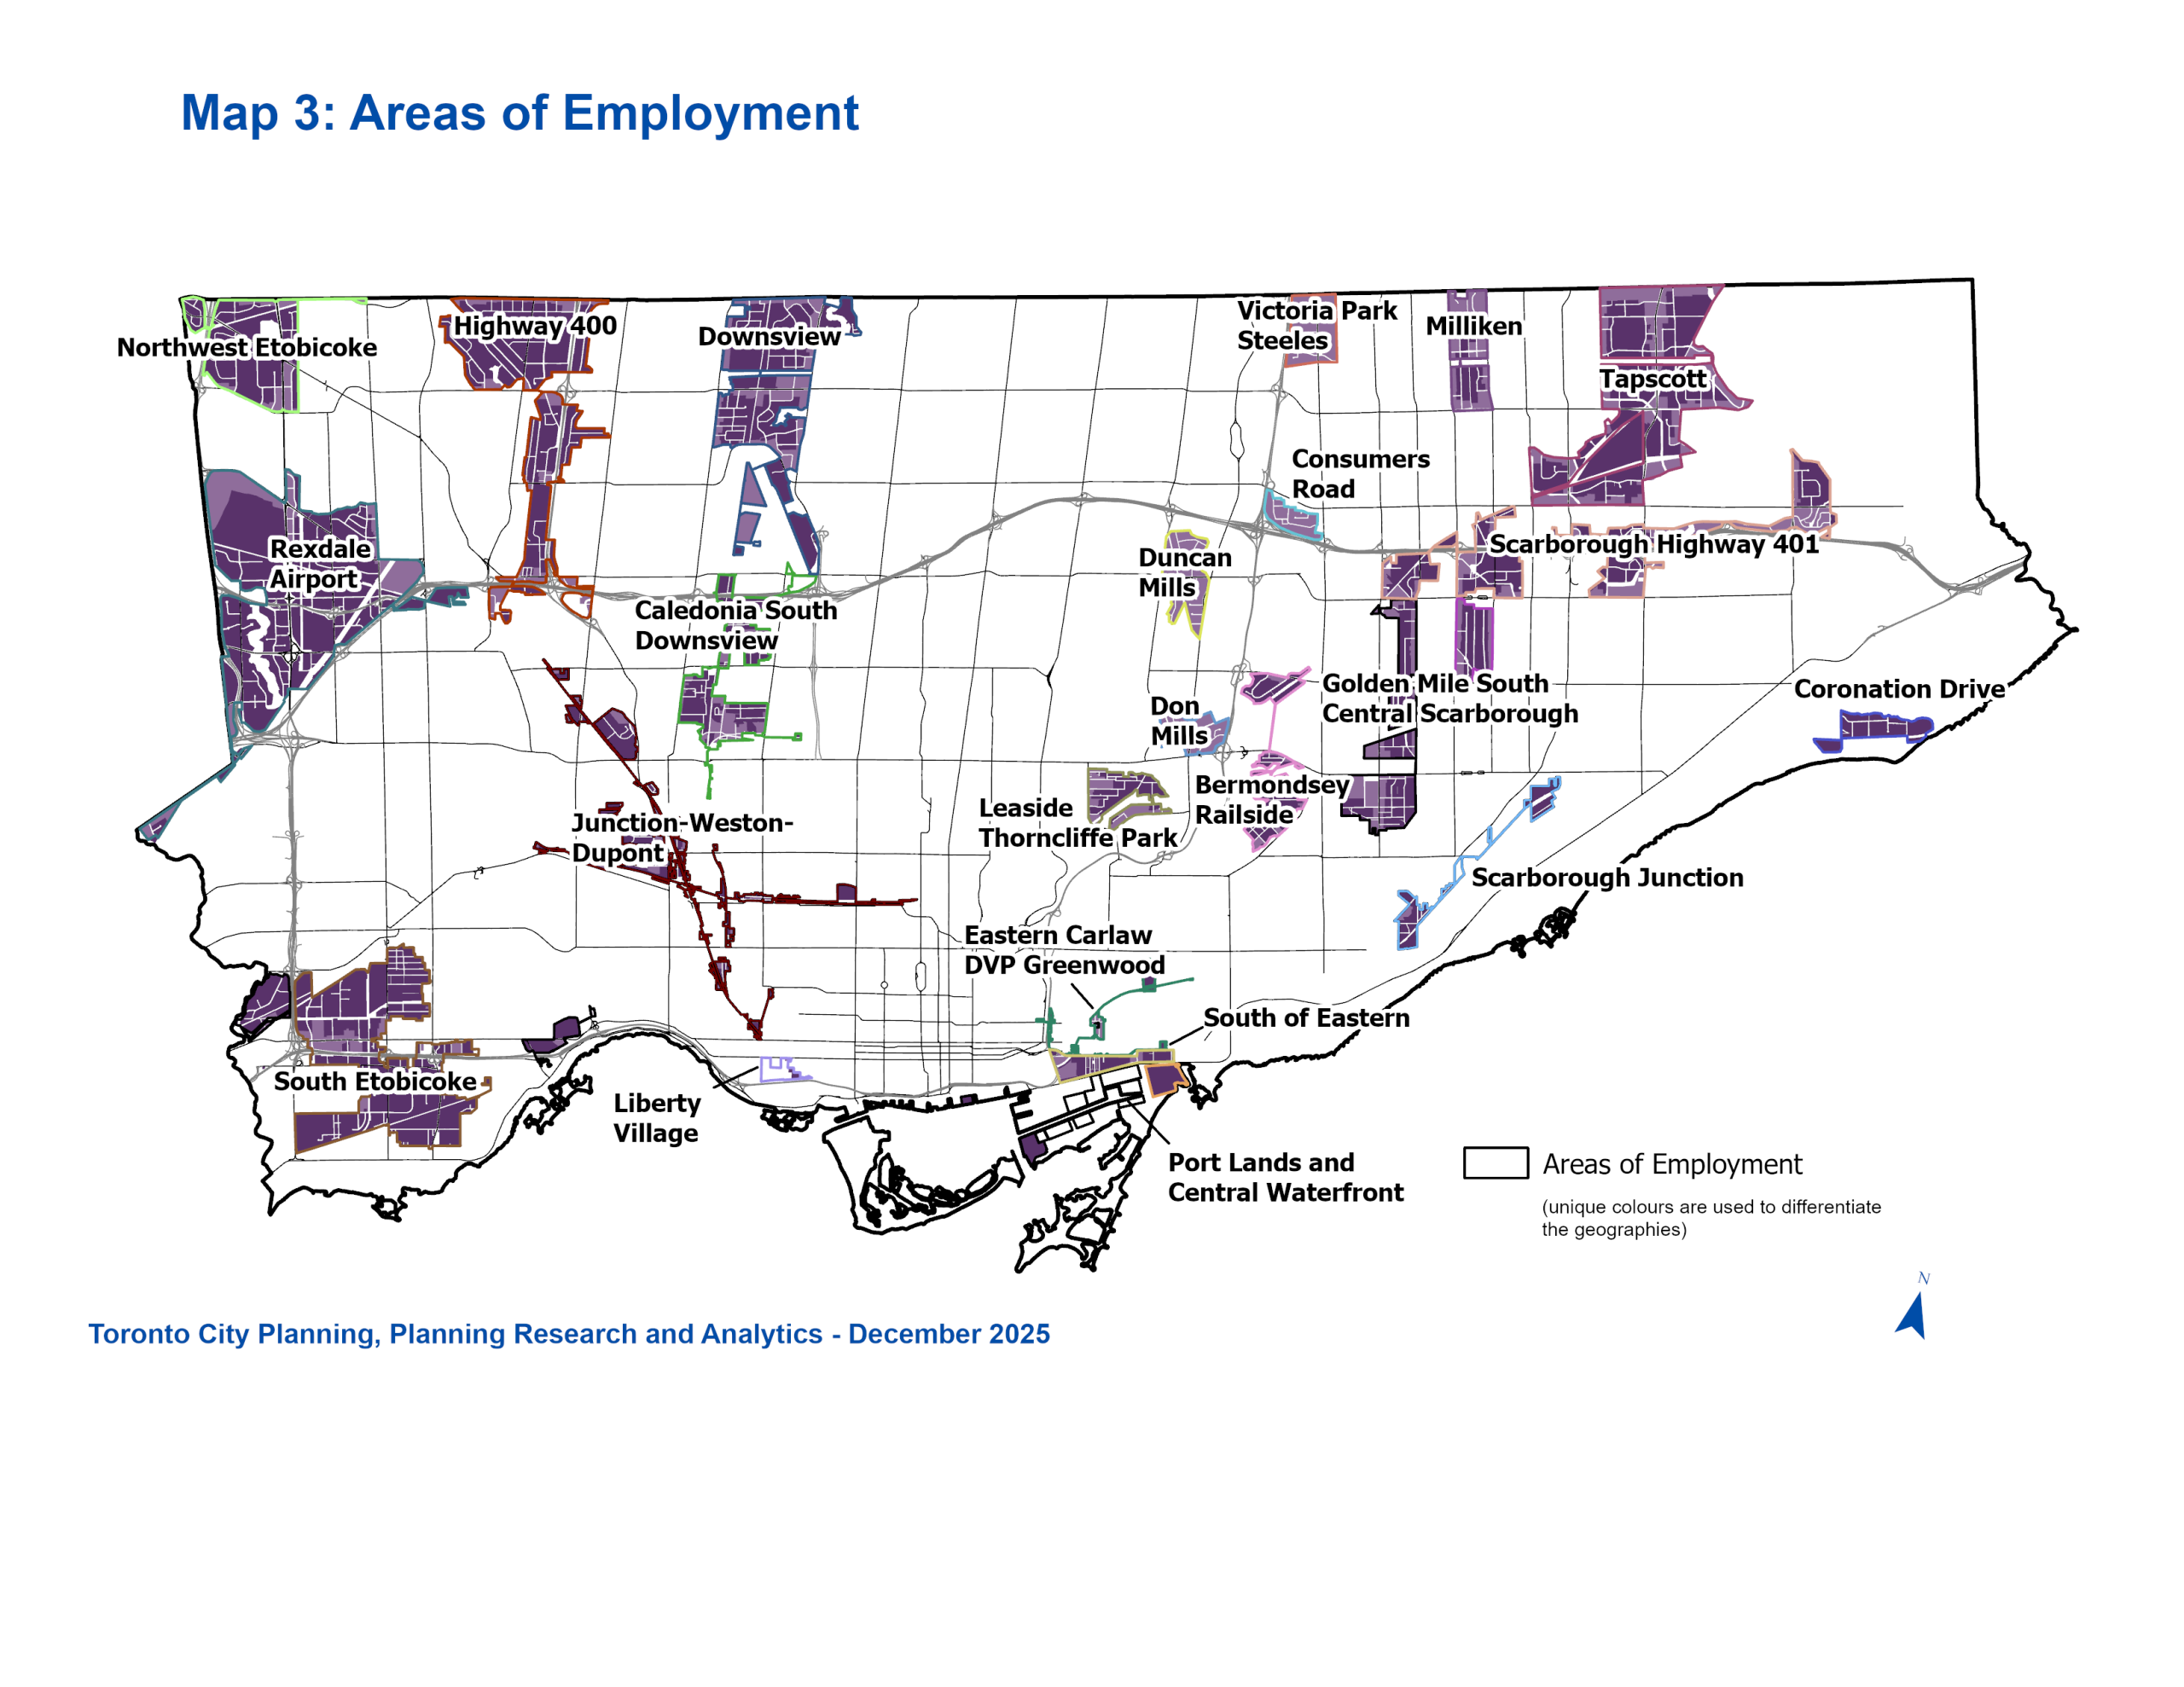
Areas of Employment
- According to the Planning Act, an “‘area of employment’ means an area of land designated in an official plan for clusters of business and economic uses”. These uses include: Manufacturing; Uses related to research and development in connection with manufacturing; Warehousing and; Associated retail and office uses, and ancillary facilities.
- There are 23 Areas of Employment (AOEs) in Toronto which represent geographic clusters of lands designated as either Core Employment Area or General Employment Area in the Official Plan.
- In 2025, employment in AOEs accounted for 412,100 jobs, or 25.4 per cent of all citywide employment, and 22,530 establishments, or 30.2 per cent of the total.
- The top five AOEs, Rexdale-Airport, South Etobicoke, Downsview, Highway 400, and Tapscott, comprise nearly half of the AOE employment with 190,070 jobs.
- The Manufacturing sector remains the largest source of jobs within AOEs with 76,450 jobs in 2025.
Map 3: Areas of Employment
Hybrid Work
The Toronto Employment Survey has been tracking work-from-home employment since the onset of the COVID-19 Pandemic. This information provides valuable insights into the changing nature of the traditional work model, allowing the City to monitor in-person and hybrid work trends.
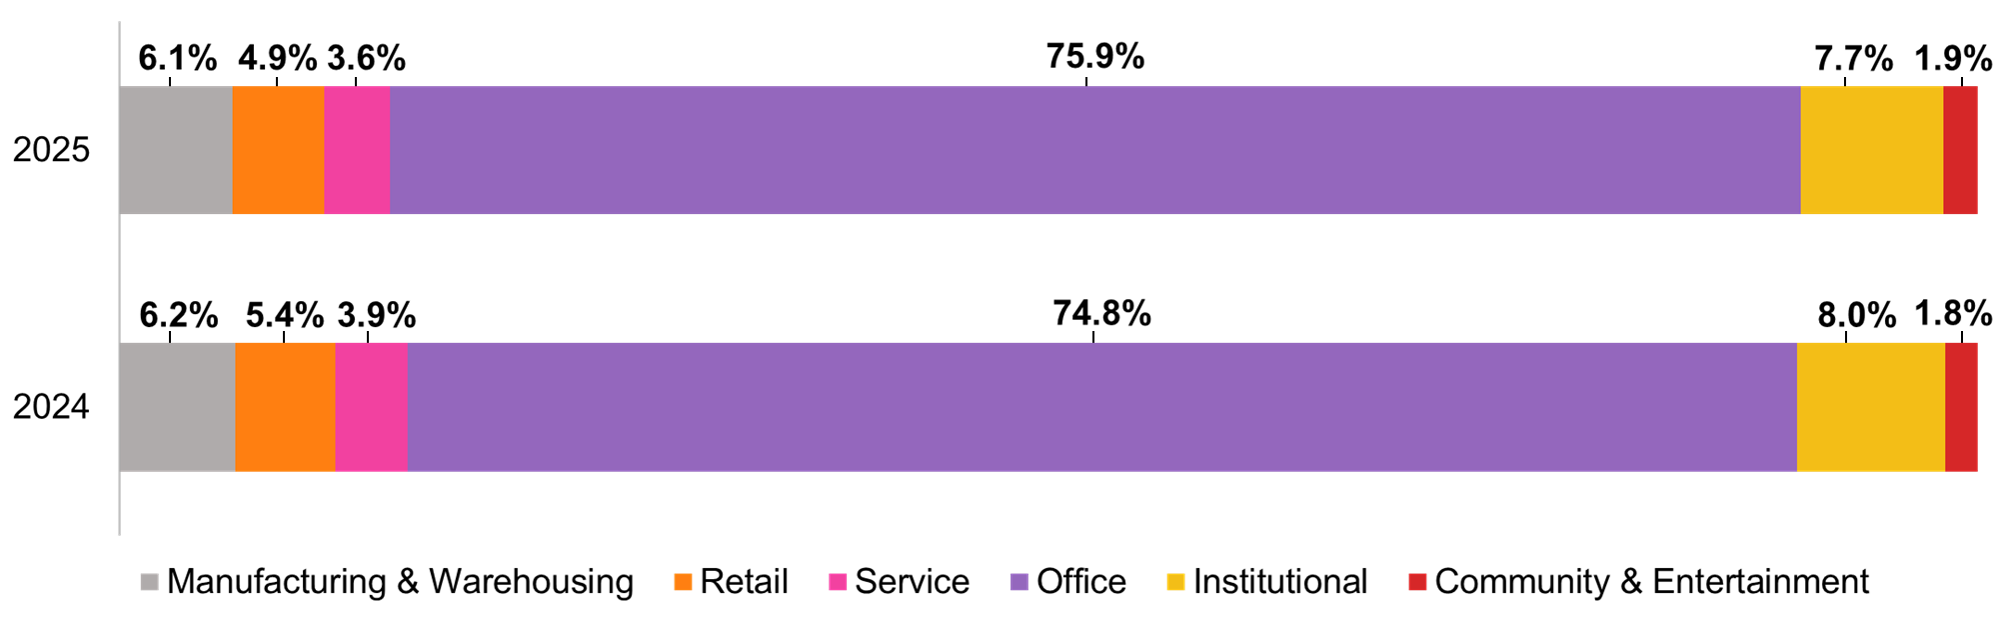
- Despite a higher response rate in 2025 for questions related to remote work, the shares of businesses reporting remote work or not remained relatively consistent with 85.7 per cent of businesses reporting having no remote work and 14.3 per cent having remote work.
- The majority of establishments reporting remote work are found in the Office category at 75.9 per cent of reporting establishments.
- Consistent since 2023, a quarter of businesses have reported having employees work on-site three days a week on average.
- Remote work remains highest in Downtown with 33.2 per cent of establishments reporting hybrid work, accounting for 156,730 employees working remotely, an increase of 29,840 employees from 2024.
Share of Establishments Reporting Remote Work Employment by Category, 2024-2025
Tariffs
- In 2025, a new question was added to the Toronto Employment Survey to assess the direct and indirect impacts of tariffs on targeted businesses engaged in international trade. Understanding the link between the level of direct exposure to tariffs and employment outcomes will help guide future research on tariffs and the industries most affected by them.
- Tariff-exposed businesses were selected from the NAICS sectors: Construction, Manufacturing, Wholesale Trade, Transportation and Warehousing, and NAICS codes related to Film Production.
- The most exposed sector is Wholesale Trade (52.9 per cent of responses) followed by Manufacturing (39.7 per cent), and Transportation and Warehousing (35.9 per cent).
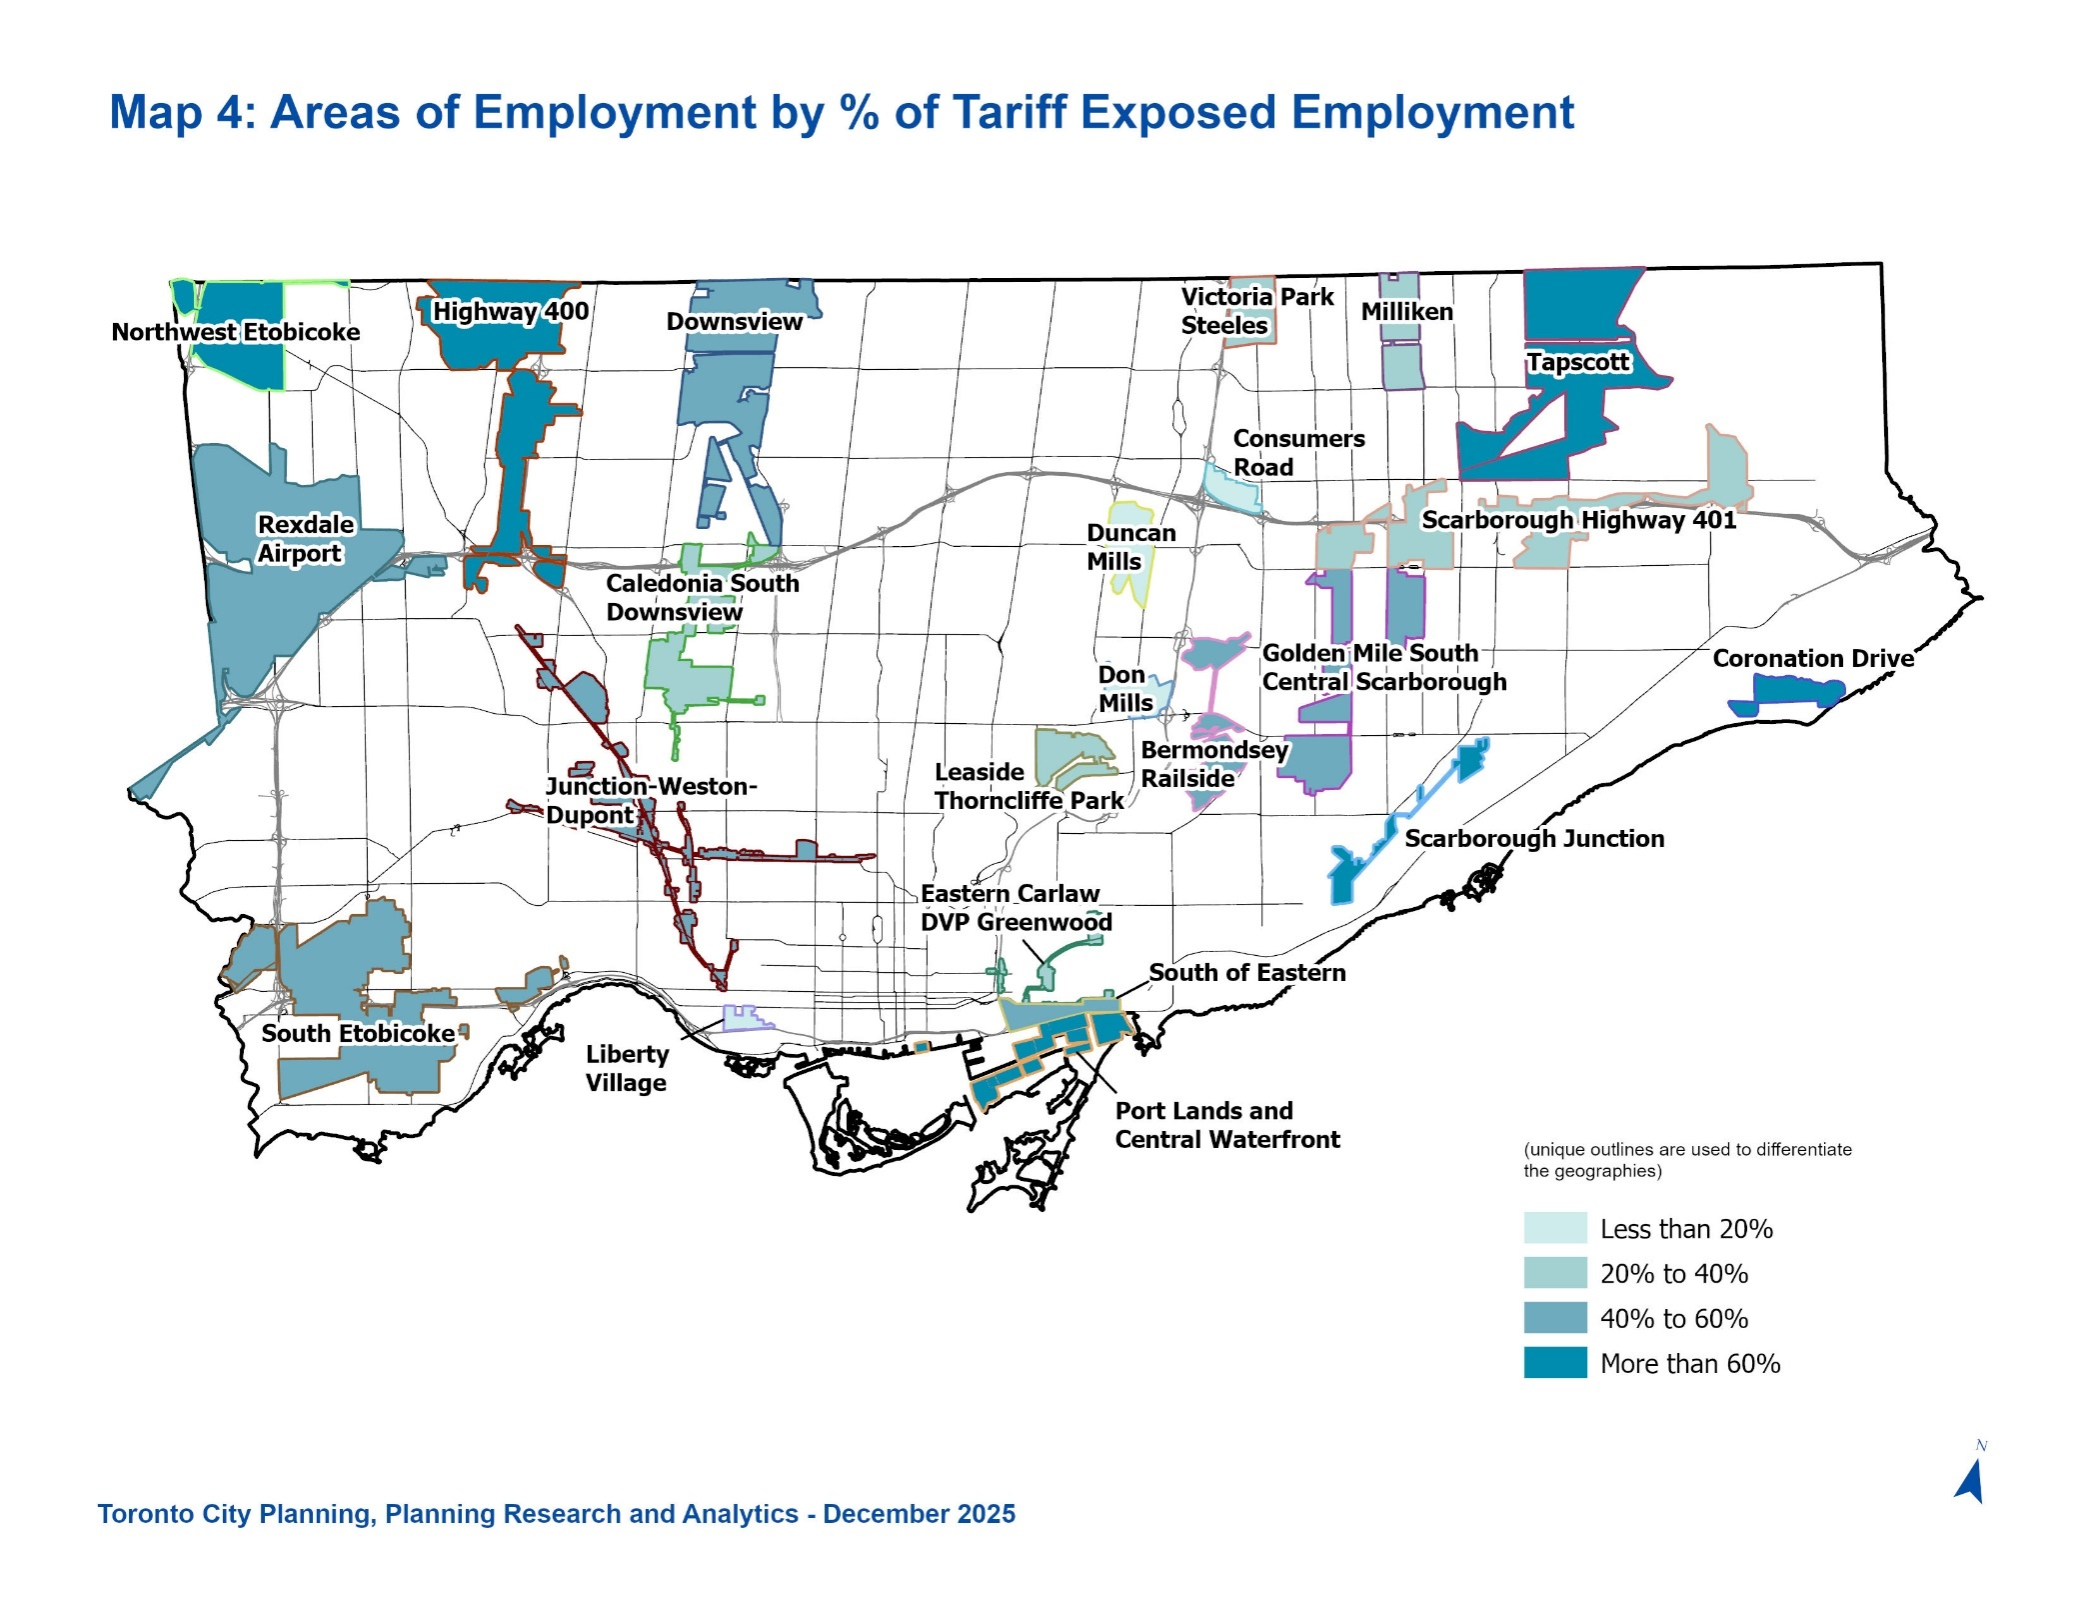
- In 2025, 42.1 per cent of employment taking place in AOEs were tariff-exposed.
- Tariff-exposed sectors experienced a 2.8 per cent decrease in employment, while all other sectors had a 2.1 per cent increase, a difference of 4.9 per cent.
Map 4: Areas of Employment by Percentage of Tariff Exposed
Survey Results from Previous Years
For copies of Employment Bulletins from 2003 to 2024, please contact Hailey Toft by telephone at 416-392-8343 or by email at cityplanning@toronto.ca.
Toronto Employment Survey Summary Tables for 2016 to 2020 and 2024-2025 are available on the Open Data Catalogue.
Date modified: April 17, 2026