The Profile Toronto bulletin “Housing Occupancy Trends 2001-2021” analyzes patterns in housing supply and demand over a twenty year period. It examines changing household characteristics and development trends and the impact they have on housing across Toronto. Toronto’s continued population growth combined with the evolution of housing types and household composition will lead to continuing changes in the city’s housing supply, demand and occupancy rates. The demand for different types of housing will be affected by the interplay of demographic change and social trends such as the timing of household formation and household composition, as well as changes in housing supply and the interaction between supply, price and affordability. Unaffordability remains a pressing issue.
To gain a better understanding of what types of housing will be needed in the future, the bulletin observes past housing demand patterns using the 2001, 2006, 2016, and 2021 Censuses of Canada and the 2011 National Household Survey. It examines the characteristics of households occupying the existing housing stock to determine potential challenges facing future housing demand and supply. What are the ages of the households? How does family composition affect housing? Has there been a shift in the demand for certain types of housing by households of a certain age and type? What does the rental and ownership landscape look like?
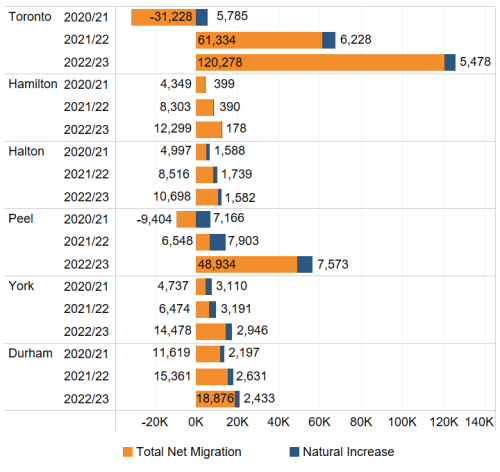
Toronto and the Greater Toronto and Hamilton Area (GTHA) have experienced significant population growth, primarily fueled by migration.
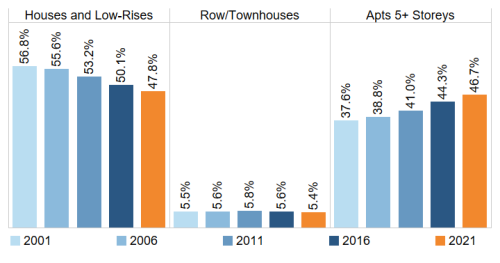
Housing is becoming more dense, with the number of mid/high-rise apartments now nearly equaling the number of houses and low-rise units. Mid/high-rise stock is housing an increasingly diverse population with varied needs.
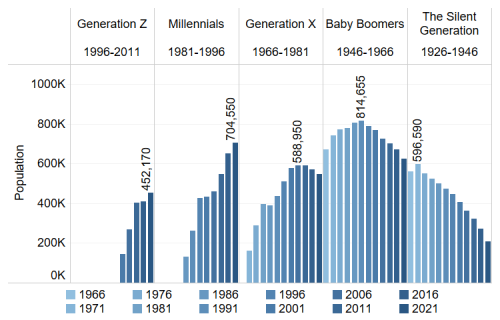
The population of Millennials is approaching the size of the Baby Boomer generation at its peak. Toronto needs to house similar numbers of Millennials as it did Baby Boomers when the earlier generation’s members were in their mid-to-late twenties.
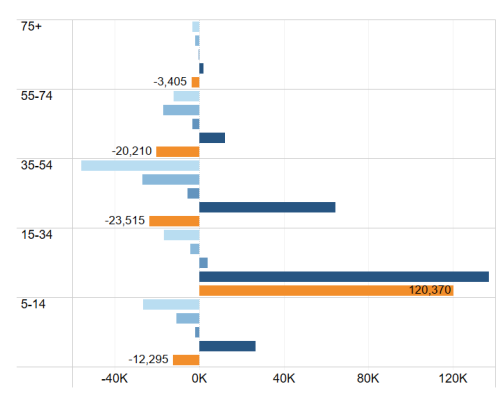
There are fewer people aged 35-54 living in Toronto than there were in the past, a trend that is attributed to people in this age group migrating out of Toronto. However, this is not a new phenomenon among that age group. While this population may decline, younger people continue to move to Toronto.
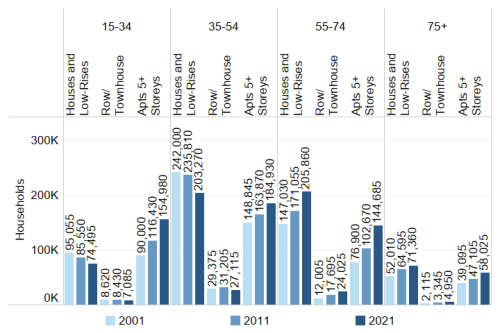
Households aged 55 and over still predominantly live in houses and low-rise units. With aging in place becoming a more common and preferred way to grow older in one’s community, some older households may not downsize and the timing of the turnover of ground-related housing stock is uncertain.
Generally, more families live in ground-related units than mid/high-rise units, while the opposite is true for non-family households. However, ground-related family occupancy is only increasing for households 55 and over. This could represent a gradual shift in preferences of younger households to mid/high-rises, or it could be because houses and low-rises are less accessible to many younger households due to affordability issues or because most of the new housing development is not in that form.
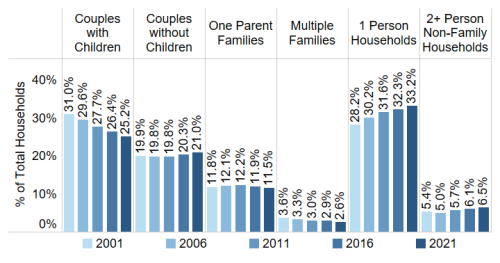
Non-family households, particularly one-person households, are on the rise, reflecting a trend towards smaller living arrangements. The number of couples with children is stable, although their proportion is declining. There has been an increase in almost all household types that live in mid/high-rise units, including couples with children.
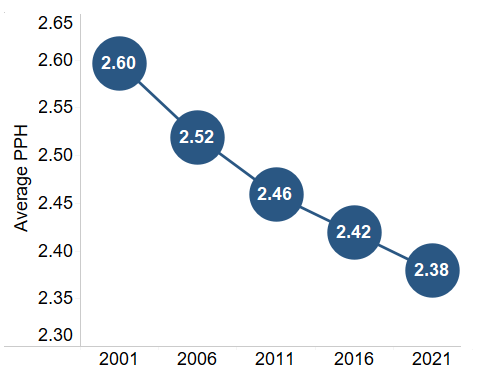
Older households are becoming larger while younger households are shrinking. Row/townhouses continue to have the largest household size among dwelling types, while the average household sizes in mid/high-rise units are below 2 persons per household for the first time.
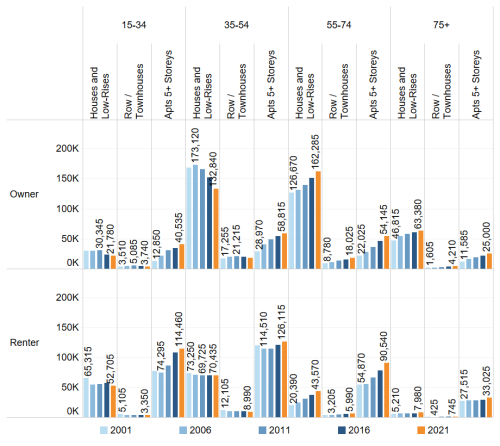
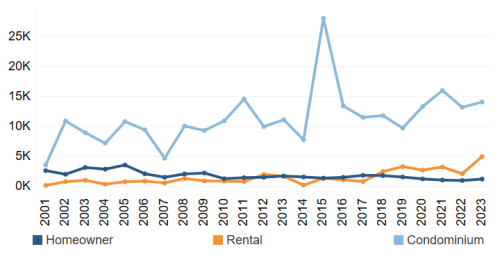
Mid/high-rise units are becoming increasingly popular among renters. The 55-74 age group is propelling the growth of house and low-rise unit ownership, while ownership of these units is decreasing for households under 55 years of age. Meanwhile, the increase in mid/high-rise rentals is being driven by households aged 15-34 and 55-74.
Almost a quarter of all renters were renting condominium units in 2021. This situation is an ongoing concern, as both condominium rental units and other secondary rental units are less secure forms of tenure than purpose-built rentals.
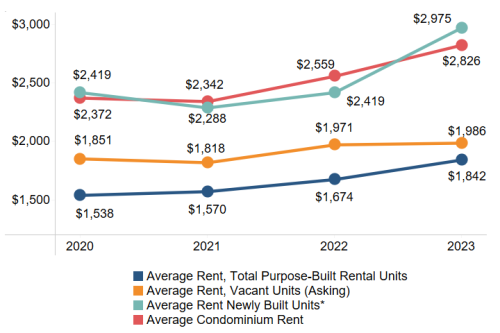
Housing prices are far outpacing income growth. In 2021, unaffordability momentarily improved for renters, however these changes appear to be a temporary situation coinciding with COVID-19 income supports. A greater proportion of renters than owners struggle with unaffordability and with core housing need, despite there being more pronounced improvements in 2021.

The 2021 Census results reported in this bulletin are a lagging indicator in some respects. Economic and market conditions have changed even in the short term since 2021. Rental rates have increased and affordability has worsened for renter households, while owner households and those who want to own are impacted by higher lending rates.
In the years between 1996 and 2016, the population of Toronto grew by 346,150 people, a 14.5% increase, while the number of households increased by 23.2%, adding 209,345 new households.
This population growth combined with the evolution of household composition, introduces several housing challenges, such as increased pressure on existing stock and demand for more units, which will require further densification and creative housing solutions.
The “Housing Occupancy Trends 1996-2011” bulletin was published in October 2015 and analyzes patterns in housing supply and demand over a fifteen year period between 1996 and 2011.
In the years between 1996 and 2011, the population of Toronto grew by 229,580 people, a 9.6% increase, while the number of households increased by 16%, adding 144,195 new households. Over the next 20 years, Toronto’s population is forecasted to reach over three million people.
This population growth combined with the evolution of household composition, introduces several housing challenges, such as increased pressure on existing stock and demand for more units, which will require further densification and creative housing solutions.
There are two previous Profile Toronto bulletins in the Housing Occupancy Trend series. These bulletins provide analysis of changes in household composition and housing occupancy between 1996 and 2006, and between 1996 and 2011. For copies of the past bulletins, please contact Hailey Toft at City Planning by telephone at 416-392-8343 or by email at cityplanning@toronto.ca.