The Land Needs Assessment is a provincially mandated study to determine the quantity of land required to accommodate forecasted population and employment growth to 2051.The Land Needs Assessment is a component of the Municipal Comprehensive Review of the Official Plan with regards to A Place to Grow: the Provincial Growth Plan for the Greater Golden Horseshoe, 2020 (“Growth Plan”). The work undertaken through the Land Needs Assessment is a critical component essential to informing the City’s growth management and intensification strategy.
For additional information about the Land Needs Assessment:
Purpose
What is a Land Needs Assessment?
- Required by the Provincial Growth Plan for the Greater Golden Horseshoe (“the Growth Plan”) as part of a Municipal Comprehensive Review of the Official Plan (MCR) undertaken to comprehensively apply the policies of the Growth Plan
- Determine the total quantity of land needed to accommodate forecasted growth to the Growth Plan horizon at 2051
- Toronto is bounded and cannot expand, so all growth is intensification
Why is it important to Toronto?
- Informs Employment Policies and the policies of Strategic Growth Areas such as Urban Growth Centres (UGCs), Major Transit Station Areas (MTSAs) and Provincially Significant Employment Zones (PSEZs)
- Long‐range projections are needed for land use planning, transportation planning and infrastructure needs
- Provides context for Secondary Plans, the Expanding Housing Options in Neighbourhoods (EHON) Initiatives and for other policies
Key Features
- Community Land Needs
- Employment Land Needs
- Alternate Growth Scenarios
- Time Frame – to 2051
Key Findings
- The analysis identified a net residential potential of 1,312,040 units, net of demolitions, with the majority (89 per cent) expected to be located in buildings with 5 or more storeys;
- The net potential housing could accommodate a population of 2,375,481 or 84 per cent growth in the City’s population after 2016 for a total population of 5,194,880;
- There is more than sufficient potential housing in areas designated in the Official Plan for residential development to accommodate Growth Plan population forecasts at 2051;
- The potential housing supply in the city is more than double the amount of housing required to accommodate the forecasted population growth between 2016 and 2051;
- The surplus potential housing stock, after accommodating the population growth forecasted by the Growth Plan at 2051, is equivalent to over fifty years of potential housing supply;
- Not all development proposals are approved, and not all approved projects are built. In any case, no one development proposal needs to be approved to accommodate the forecasted population growth to 2051;
- Not all of the forecasted population growth needs to be accommodated in new housing stock: one quarter of the population growth forecasted by the Growth Plan can be accommodated through the generational turnover of the housing stock that existed in 2016;
- Despite this supply potential, there is a mismatch between the types of housing that people are seeking and the mix of housing types that are anticipated to be built in the short term. The Housing Action Plan seeks to help address the mismatch between the projected demand for different types of housing and the anticipated supply by prioritizing a broader mix of rental, affordable, and ground-oriented homes;
- Achieving the Municipal Housing Target would require more units to be built than would be required to accommodate the growth currently forecasted or projected by the Province by 2031. See also the Staff Report “A Housing Pledge for the City of Toronto”, Item 2023.PH3.8;
- The City has identified a potential net new housing supply of 646,336 units by 2031, which is 227 per cent of the Municipal Housing Target. If the current rate of Council approvals continued and the units were realized, the Target could be met, and exceeded. However, achieving the Target would require continual improvements to approval processes and active participation from the development industry and housing providers, and the City would require the financial resources and tools to fund housing-enabling infrastructure;
- The Growth Plan policies represent minimum standards within the framework of the Provincial policy-led planning system. Council has the ability to go beyond these minimum standards to address matters of importance, such as the 2031 Municipal Housing Target;
- Toronto’s total employment is projected to grow from 1,607,800 in 2016 to between 1,938,800 and 2,101,200 jobs in 2051, while jobs in Employment Areas are projected to grow from 410,700 to between 456,600 and 498,600;
- As Toronto is unable to expand its settlement area, it needs to retain and intensify its currently designated Employment Areas to accommodate the forecasted employment growth.
Community Area Land Needs for Housing
- The Land Needs Assessment study was undertaken in parallel with other elements of the MCR. This study has as its starting point and context the growth management, intensification and employment land strategies established by the Official Plan, as amended from time to time.
- The Study methodology reflects the Provincial Land Needs Assessment Methodology. Some components of the Provincial methodology do not apply to the City of Toronto.
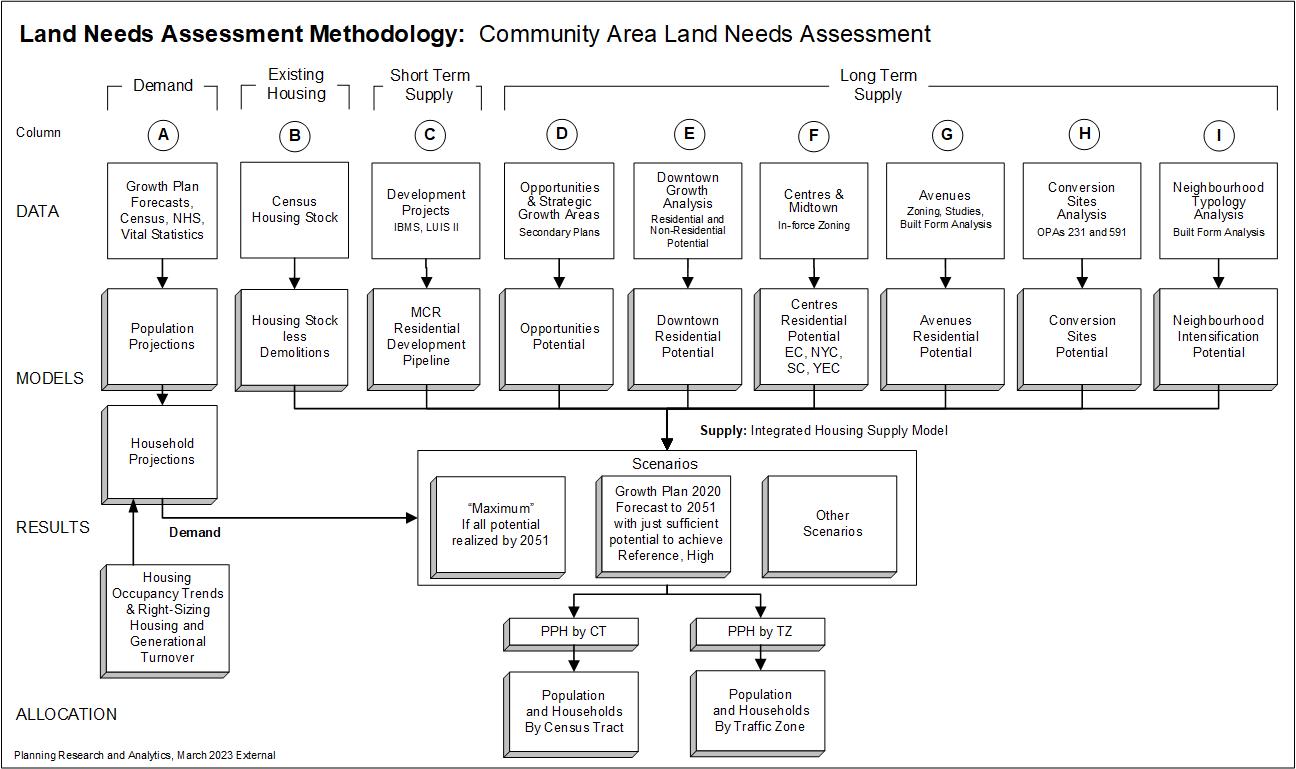
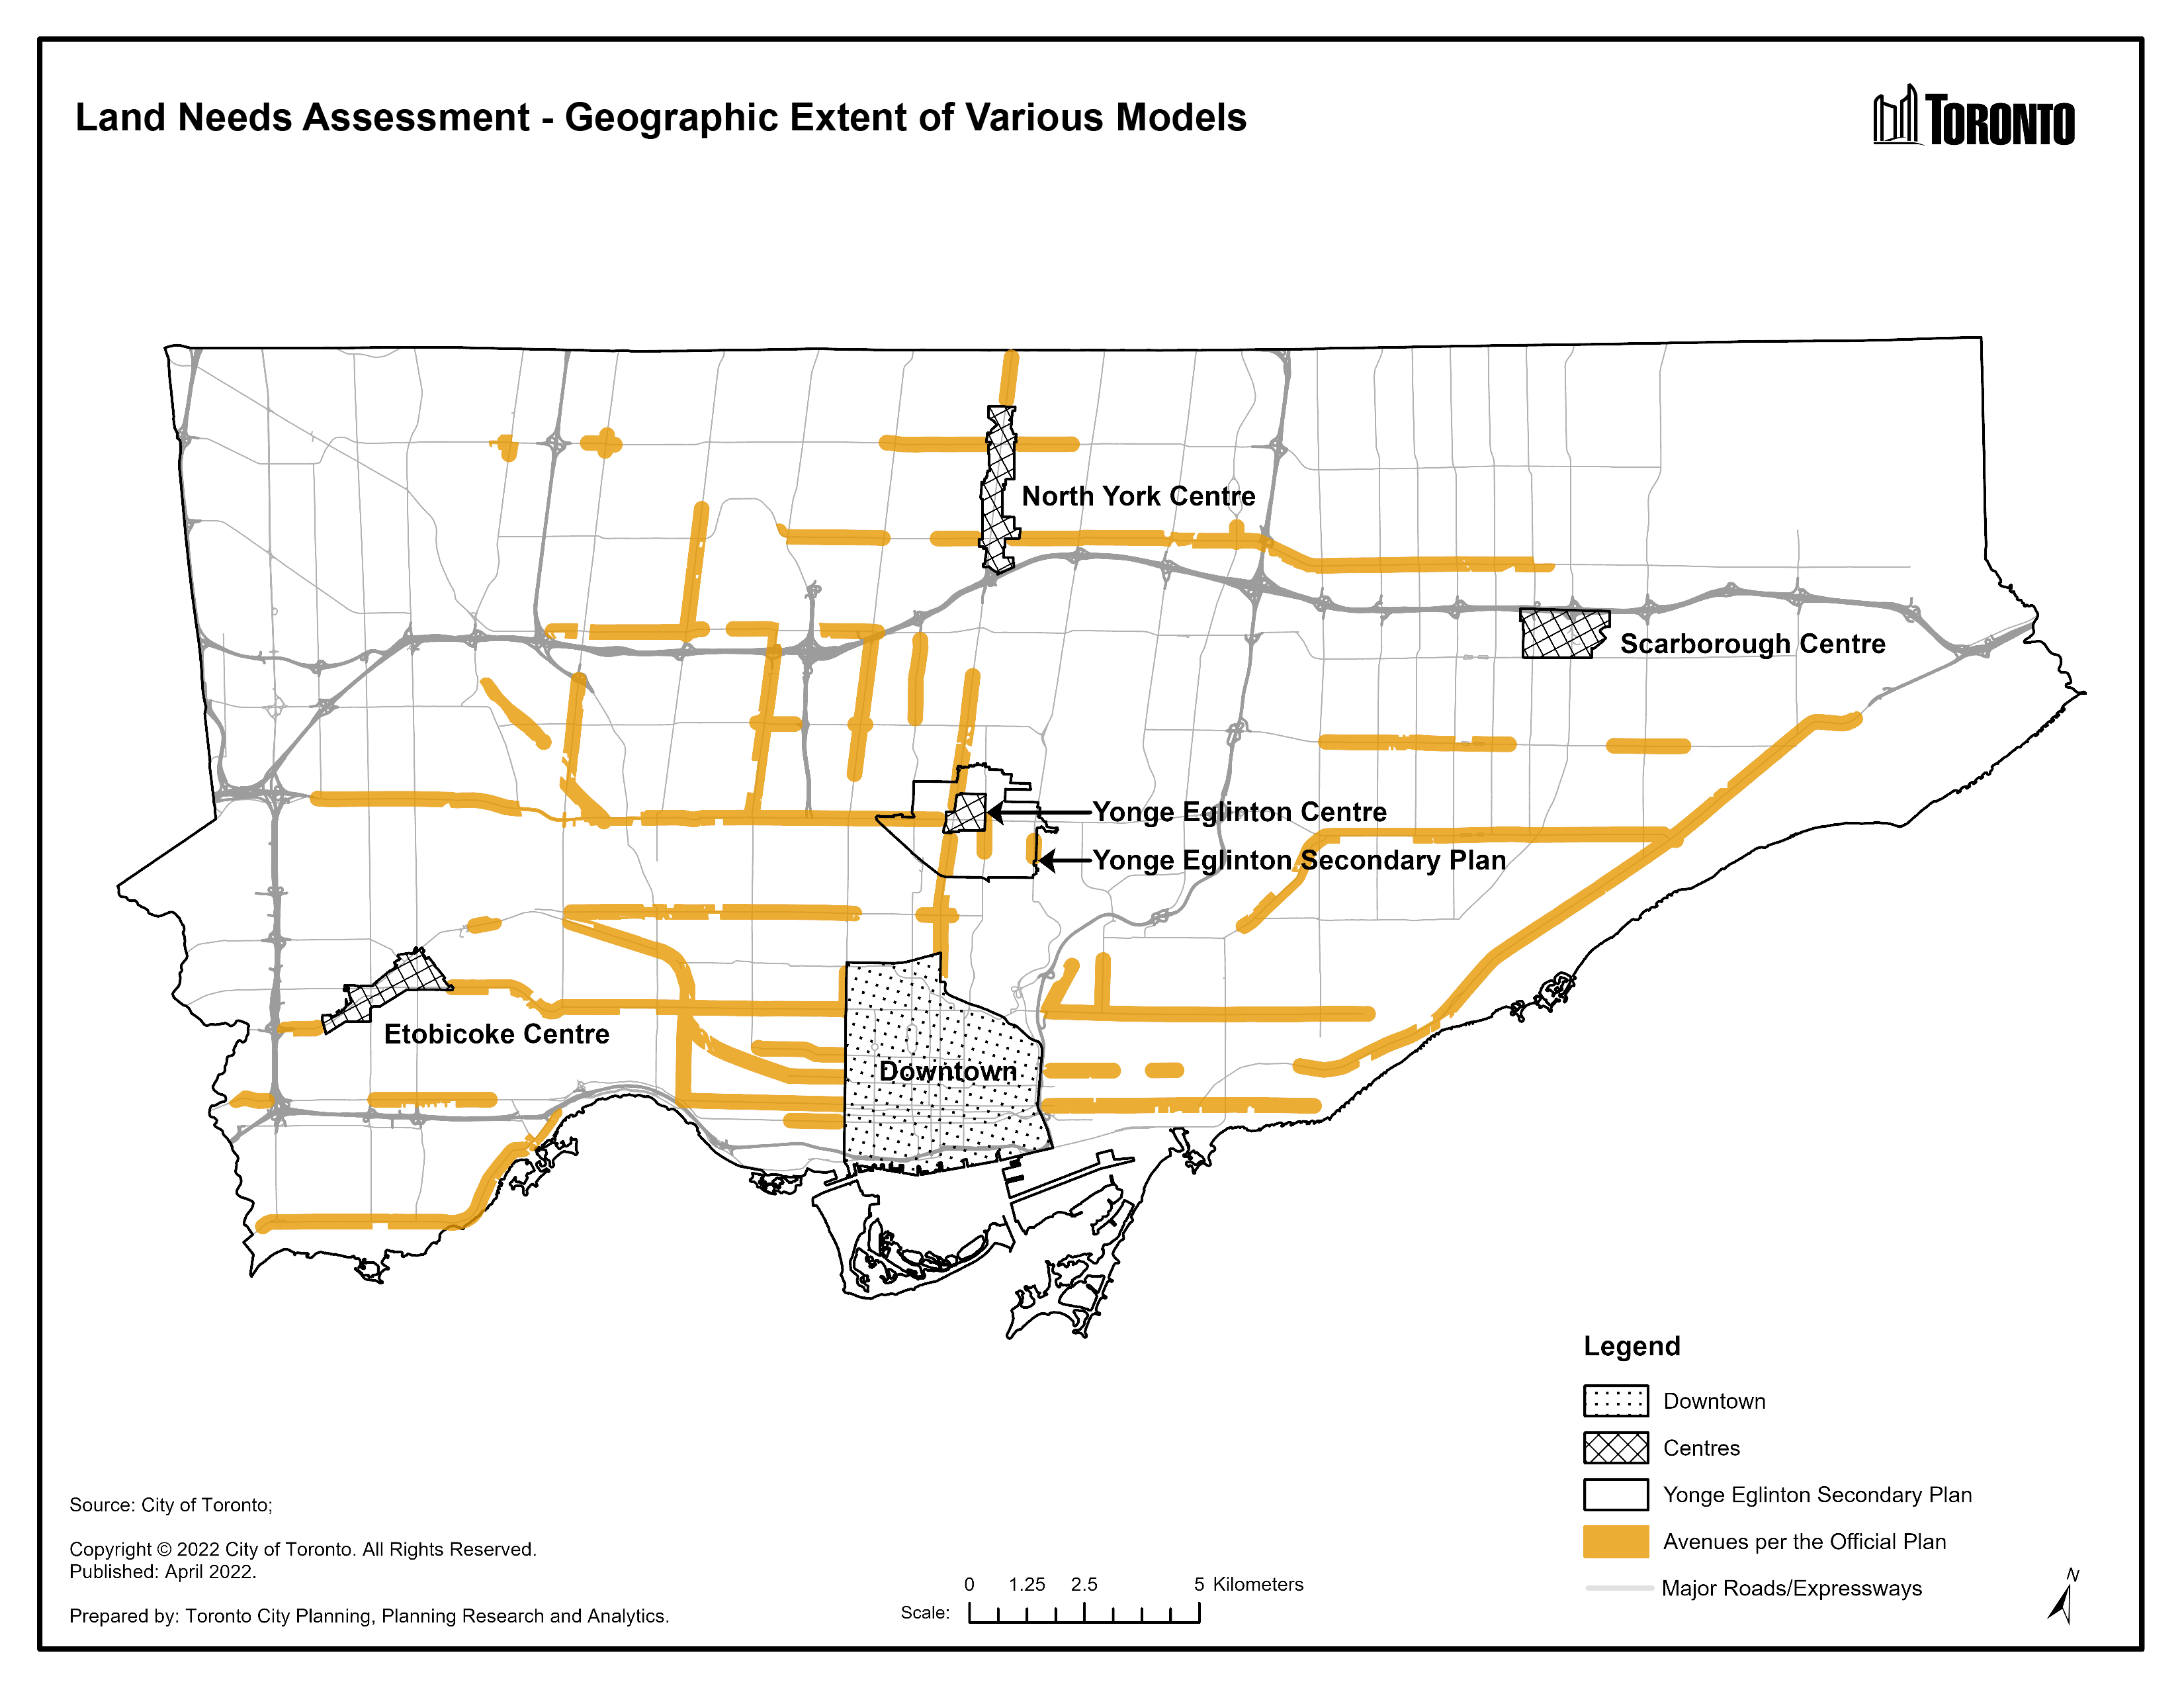
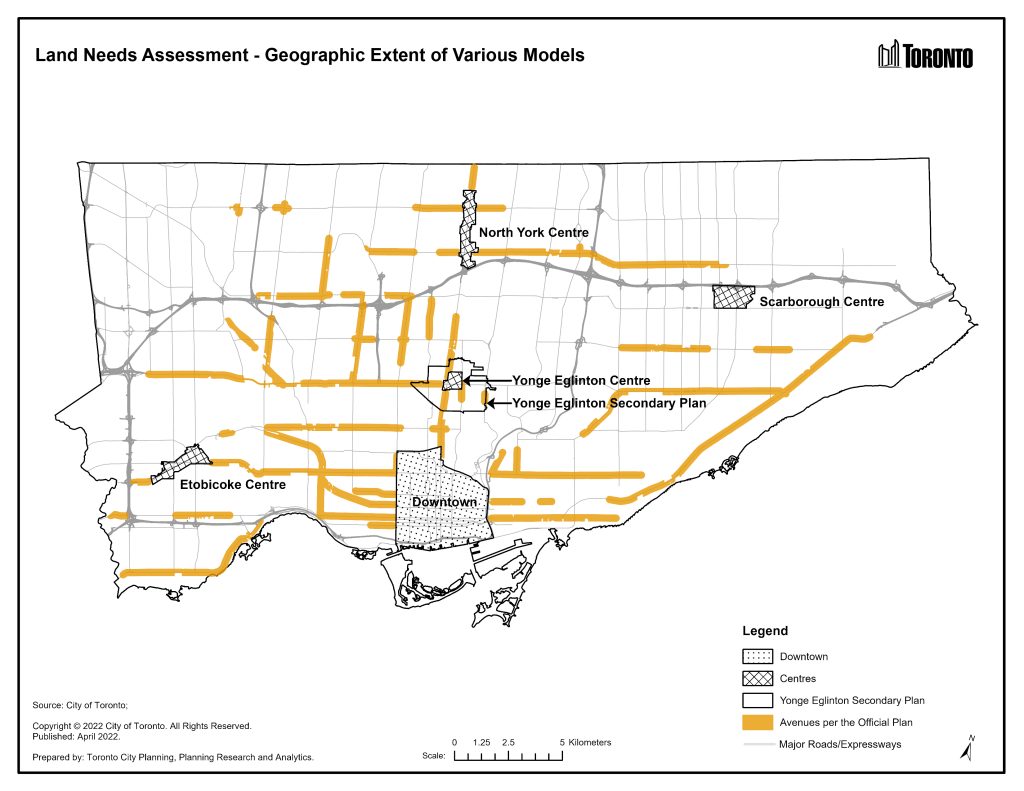
- In order to implement the Official Plan and to assess the city’s land needs over the forecast horizon of the Growth Plan, projections of population and households by type of dwelling for small geographic areas were required. The methodology for the Community Area Land Needs for population and housing is displayed in Figure 1 while Figure 2 shows the principal geographic study areas of the sources of potential housing supply.
Figure 1: Land Needs Assessment Methodology – Community Area Land Needs Assessment
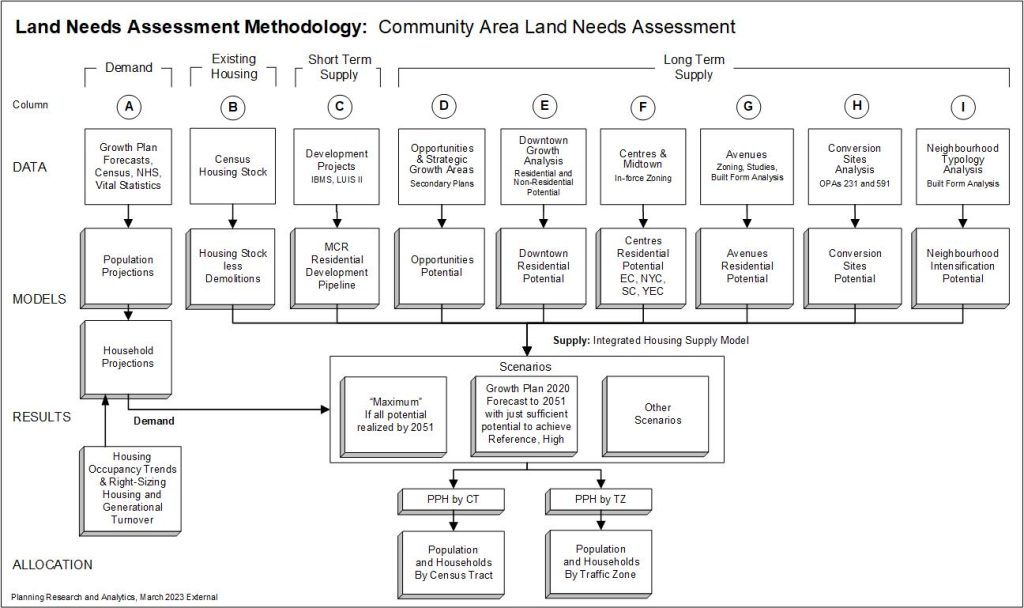
Figure 2: Map of LNA Model Study Areas
Employment Area Land Needs
- Small-area employment projections for the City of Toronto have been developed by staff and with consulting support from Hemson Consulting Ltd. (“Hemson”). As specified in the Provincial Land Needs Assessment Methodology for the Greater Golden Horseshoe (2020), this analysis must “forecast employment using Schedule 3 forecasts or alternate growth scenarios as a minimum as well as the North American Industry Classification System (NAICS) by usual Place of Work, no fixed workplace within the municipality and work at home”.
- The previously published version of the Employment Projections in 2022 was premised on Hemson’s expectation that Toronto’s employment growth would likely recover within three years of the onset of the COVID-19 pandemic. However, as of 2022, Toronto’s employment levels remained approximately 5 per cent below that recorded in 2019 by the Toronto Employment Survey. With challenging global economic conditions, more conservative growth scenarios are presented in the 2023 update that reflects Toronto’s slower recovery rate. The updated model considers the latest Toronto Employment Survey results, the revised Development Pipeline, an updated opportunities analysis, and a more extensive analysis of Floor Space per Worker ratios.
- Toronto’s total employment is projected to grow from 1,607,800 in 2016 to between 1,938,800 and 2,101,200 jobs in 2051 (see Table 1).
- By 2051, Employment Area jobs are projected to increase from 410,700 to between 456,600 and 498,600.
- As Toronto is unable to expand its settlement area to accommodate projected employment growth in Employment Areas, existing designated lands will need to be retained and intensified.
- Conversions to other land uses should only occur strategically and include secured employment.
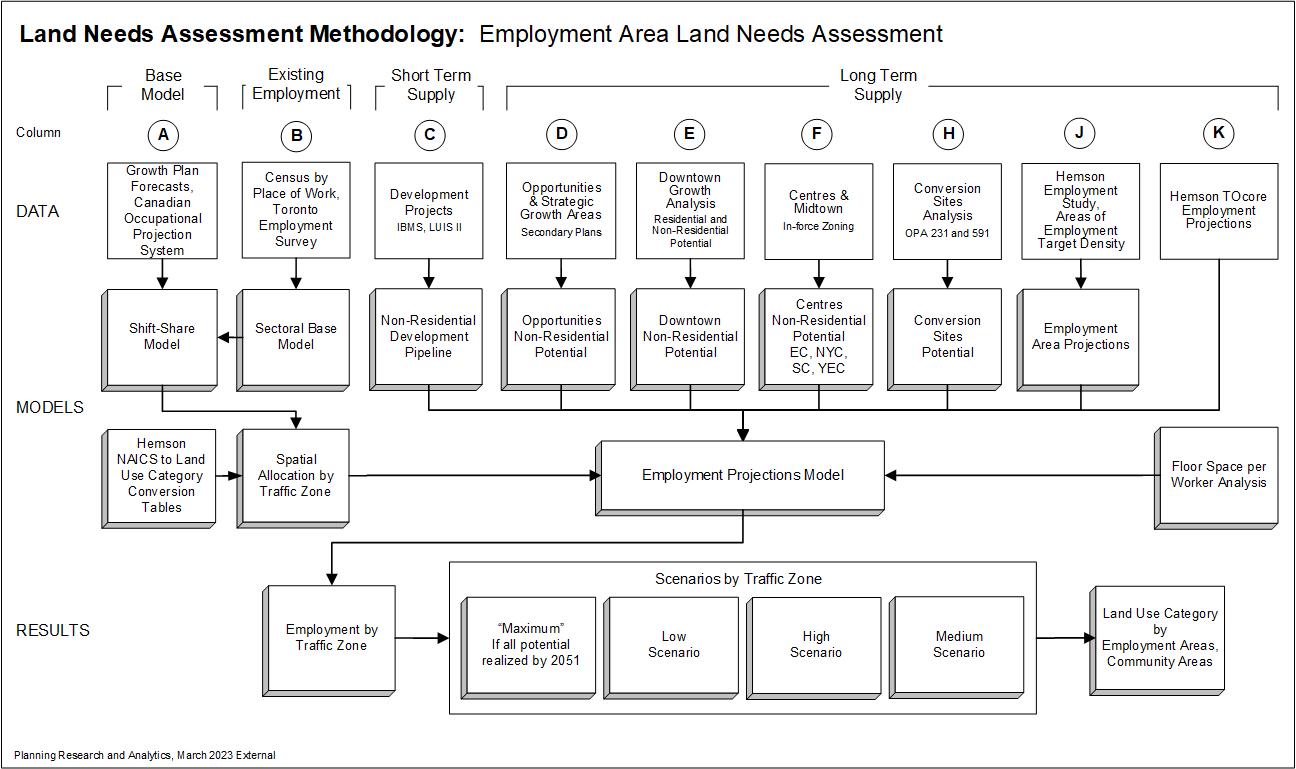
Figure 3: Land Needs Assessment Methodology – Employment Area Lands Needs Assessment
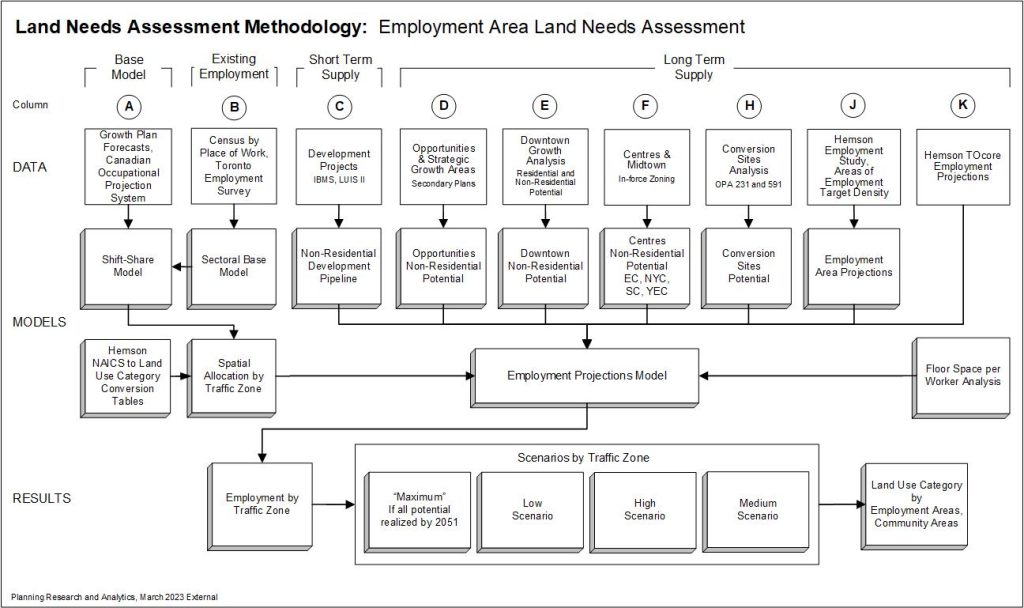
Table 1: Citywide Employment Projections
| Projection Type |
2016 |
2051
Reference |
2051
Low |
2051
Medium |
2051
High |
| Land Use Category |
1,607,800 |
1,978,800 |
1,938,800 |
2,006,100 |
2,101,200 |
| Major Office |
639,700 |
1,006,600 |
867,600 |
897,700 |
941,900 |
| Population-Related |
661,200 |
687,900 |
756,700 |
781,100 |
815,200 |
| Employment Land |
306,800 |
284,300 |
314,500 |
327,400 |
344,200 |
| Geographic Allocation |
1,607,800 |
1,978,800 |
1,938,800 |
2,006,100 |
2,101,200 |
| Employment Area |
410,700 |
448,500 |
456,600 |
474,400 |
498,600 |
| Community Area |
1,197,000 |
1,530,260 |
1,482,200 |
1,531,700 |
1,602,600 |
| Place of Work Status |
1,607,800 |
1,978,800 |
1,938,800 |
2,006,100 |
2,101,200 |
| Usual Place of Work |
1,342,400 |
1,654,800 |
1,614,800 |
1,674,100 |
1,757,000 |
| Work At Home* |
101,300 |
131,200 |
131,200 |
131,200 |
131,200 |
| No Fixed Place of Work |
164,100 |
192,800 |
192,800 |
200,800 |
213,000 |
* Work At Home projections are a product of Hemson’s assumptions of employment by industry as a share of the population
Municipal Housing Target
- The LNA has identified net potential housing by 2031 that is 227 per cent of the Target (Table 2)
- Achieving the Municipal Housing Target would require more units to be built than would be required to accommodate the growth currently forecasted or projected by the Province by 2031.
- If the current rate of Council approvals continued and the units were realized, the Target could be met and exceeded, but this would depend on:
- continual improvements to approval processes
- active participation from the development industry and housing providers
- the City having the financial resources and tools to fund housing‐related infrastructure.
Table 2: Forecasts & Projections versus Municipal Housing Target
| Growth Scenarios |
Supply Required |
Demolitions |
Net New Units |
% of Target |
Surplus / Shortfall |
% of Target |
| Municipal Housing Target |
2021 - 2031 |
|
285,000 |
100% |
0 |
0% |
| Hemson 2020 Reference |
169,626 |
16,003 |
153,623 |
54% |
-131,377 |
-46% |
| Hemson 2020 High |
179,236 |
15,927 |
163,309 |
57% |
-121,691 |
-43% |
| Hemson 2022 High & ADE 2023 |
233,559 |
16,097 |
217,462 |
76% |
-67,538 |
-24% |
| Ministry of Finance 2022 |
294,147 |
16,275 |
277,872 |
97% |
-7,128 |
-3% |
| Maximum |
663,675 |
17,339 |
646,336 |
227% |
361,336 |
127% |
| Average Units p.a. at First Planning Approval 2017-2021 |
29,726 |
|
|
|
| Average Units Built per annum 2017-2021 |
15,983 |
|
|
|
| Percentage of Approved Units eventually Built |
54% |
|
|
|
| If Maximum Scenario net new units Approved & Built |
347,520 |
122% |
62,520 |
22% |
Growth and the City’s Official Plan
- Toronto’s Official Plan came into force in June 2006 and has subsequently undergone a number of thematic amendments to bring it into conformity with the Growth Plan and the Provincial Policy Statement, supported by the technical report Greater Golden Horseshoe: Growth Forecasts to 2051.
- The Official Plan is the guide for development in the city over the coming decades. Its central geographic theme is to direct growth to appropriate areas given their access to transit and other community services and facilities and away from the city’s stable residential neighbourhoods and green spaces.
- The locations recognized as being most appropriate for growth are those identified in the Official Plan’s Urban Structure Map as Downtown, Centres, Avenues as well as other areas in the city designated as Mixed Use Areas and Employment Areas.
Date modified: August 8, 2024