A Housing Needs Assessment (HNA) is a report informed by data and research that describes the current and future housing needs of a municipality or community.
HNAs provide data to support evidence-based decision making at the local and community level. Having this data helps all orders of government make informed decisions about their infrastructure and housing investments to help determine where and what kind of housing needs to be provided for and built.
This HNA was prepared in summer 2025 as a requirement of the Canada Community-Building Fund (CCBF)
In this section, applicants should outline the research methodology used to inform the completion of the assessment, where the methodology is derived from, any assumptions used, and any necessary justification. While different assessments may incorporate unique methodological elements or considerations depending on context, the following methods should generally be outlined:
Both qualitative and quantitative aspects of this guidance document are equally important.
Communities will be required to engage with key stakeholders in the housing sector, including non-profit housing providers, developers, and public entities, as well as those with specific lived experiences, to develop a comprehensive Housing Needs Assessment (HNA). This section should include what forms of engagement were conducted, with whom, how learnings were incorporated into or informed the HNA’s findings, and what engagement opportunities may exist to share findings with the community.
To the extent possible, publicly available data from the following sources will be prepopulated to facilitate automated completion of the quantitative components of the assessments:
In addition to this data, communities are required to incorporate internal and non-public facing, non-confidential data, into their HNAs in order to more fully capture local contexts and realities as needed.
If this data is unavailable at the time of completion of the first HNA, communities are expected to collect these data points for future iterations.
Toronto’s Housing Needs Assessment (HNA) included qualitative and quantitative analysis of housing need, demand, and supply at both the city level at sub-geographies throughout the city which go far beyond the HNA requirements. This allowed for an in-depth analysis of housing need, demand, and supply in the city, and throughout its diverse neighbourhoods and provided a solid evidence base to set meaningful housing targets.
The HNA included analysis of city-wide and geography-specific data from Statistics Canada’s 2006, 2016 and 2021 Censuses, including custom data on various indicators such as household incomes for renters and owners in the City of Toronto; Canada Mortgage and Housing Corporation (CMHC), including custom data on the housing market; Toronto Real Estate Board; Altus market housing prices, including custom data on average home prices by bedroom type; Urbanation; and City data related to proposed developments and other key indicators. The following indicators were analyzed to identify the housing supply, need and demand across the city and in selected sub-geographies.
View the previous Housing Needs Analysis.
Extensive engagement activities were undertaken as part of the work on the HNA. The objective of these engagements was to identify housing need and priorities in Toronto from a range of perspectives. Pre-engagement interviews were held with key stakeholders to help develop the approach to community consultation. The result of this was the identification of a variety of techniques that would help reach a diverse range of Toronto residents. The engagement activities included over 40 key stakeholder meetings, seven public meetings attended by approximately 450 attendees, and an online survey with over 475 respondents. Other engagement opportunities included 12 do-it-yourself workshops with over 130 participants, written submissions, and social media.
Read additional information on the approach and outcome from these activities.
The development of the HNA included engaging with a wide range of stakeholders, including housing advocates and representatives of the for-profit and not-for-profit development sectors. Pre-engagement interviews with key stakeholders were undertaken to identify the most appropriate approach to engaging with different stakeholder groups and which groups to engage with. The approach to these engagements is outlined in the response to the previous question.
Stakeholders who were engaged include representatives of the following priority groups:
In addition, the Housing Needs Assessment was informed by consultations held by the City in 2019 to inform the develop of the City’s HousingTO 2020-2030 Action Plan, which is the City’s current ten-year housing plan. Almost 6,000 members of the public and stakeholders from across Toronto’s housing spectrum, with over 1,000 hours of time logged between in-person and online consultation activities. Read more about the consultations.
In this section, communities are expected to tell their housing story through the lenses of their community and household profiles using both qualitative and quantitative data. Communities may structure this information in different ways, including by providing past benchmarks, present figures, future projections, and current growth rates at a local, regional and provincial level.
Toronto’s Official Plan provides a roadmap to guide how the city grows. It presents a vision of a city that can meet the needs of every resident and seeks to address some of the city’s key priorities, including sustaining housing affordability.
Section 3.2.1 of Toronto’s Official Plan contains housing policies that speak to four areas: stimulating production of new private sector rental housing supply; preserving existing housing, particularly affordable rental housing; making efficient and effective use of the City’s own housing resources, specifically rent-geared-to-income housing; and working in partnership with other levels of government as well as private and non-profit sectors to take advantage of opportunities.
The policies speak to the provision of a full range of housing in terms of form, tenure and affordability across the city. There are also several policies that specifically address the provision of affordable housing, including on sites that are greater than five hectares and in new residential developments where the inclusionary zoning policy applies, although the implementation of this policy is currently on hold pending provincial approval of identified Protected Major Transit Station Areas.
Various Secondary Plans for specific areas across the city also speak to the provision of affordable rental housing as a proportion of new residential development. These policies support the objective to provide a full range of housing across the city, including affordable housing as defined in the Official Plan based on the household income and size of Toronto households, and to help ensure the creation of complete, inclusive communities.
The Official Plan also has policies that preserve existing affordable and mid-range rental housing by requiring the replacement of these units when demolition for redevelopment is proposed and by requiring renovations or improvements to extend the life of the existing rental building when infill is proposed on sites where there is affordable and mid-range rental housing.
In addition to the Official Plan, the City is currently implementing the HousingTO 2020-2030 Action Plan (HousingTO Plan) and the 2022-2026 Housing Action Plan (HAP). The HousingTO 2020-2030 Action Plan (HousingTO Plan) and the HAP guide the City’s work to create a healthy housing system and focus on enabling a range of housing options for current and future residents. These plans, guided by the Toronto Housing Charter and the City’s commitment to the progressive realization of the right to adequate housing, employ a multi-faceted approach in responding to the structural and systemic barriers that have contributed to the ongoing crises, particularly impacting Indigenous and Black communities, women, seniors, youth, 2SLGBTQIA+ and other equity deserving groups. Both of these plans are advancing the City’s efforts to achieve its housing pledge of meeting or exceeding the provincial target of 285,000 new Toronto homes between 2022 and 2031. This target represents an ambitious goal and is a call to action for the City of Toronto, other orders of government and stakeholders to accelerate timelines and get housing built.
| Characteristic | Data | Value |
|---|---|---|
| Total Population (number) | 2016 | 2,731,571 |
| 2021 | 2,794,356 | |
| Population Growth (number) | Total | 62,785 |
| Percentage | 2.3% | |
| Age (Years) | Average | 41.5 |
| Median | 39.6 | |
| Age Distribution | 0-14 years | 384,300 |
| 15-64 years | 1,933,075 | |
| 65+ years | 476,985 | |
| Mobility | Non-movers | 2,382,090 |
| Non-migrants | 261,975 | |
| Migrants | 92,845 |
| Characteristics | Data | Value |
|---|---|---|
| Immigrants | Total | 1,286,140 |
| Non-Immigrants | Total | 1,329,905 |
| Recent Immigrants (2016-2021) | Total | 198,040 |
| Interprovincial migrants (2016-2021) | Total | 43,685 |
| Indigenous Identity | Total | 22,925 |
Between 2016 and 2021, Toronto’s population grew by 2.3 per cent and accounted for roughly 7.6 per cent of the country’s total population. While Toronto continues to grow, the 2021 Census showed a slowing growth rate compared to the previous 2016 Census period. The city is also evolving and aging. Currently, there are more people age 65 or older in Toronto than there are people under the age of 15. The main population outflow in major cities like Toronto are people under 19, and aged 25-44, many of whom are looking for more affordable housing options. With a slowing natural birth rate and aging population, Toronto relies heavily on immigration to support its continued growth and prosperity. Toronto’s population remains diverse with less than 50 per cent of the population born in Canada and more than 50 per cent of the population belonging to a racialized group.
This section should provide a general overview of income, housing and economic characteristics of the community being studied. Understanding this data will make it easier to observe the incidence of housing need among different socio-economic groups within the community. Income categories could be used for this analysis and can be completed in accordance with the HART methodology and CMHC data.
Area Median Household Income (AMHI) can be used as the primary basis for determining income brackets (as a percentage of AMHI) and corresponding housing cost ceilings.
This section should also outline the percentage of households that currently fall into each of the income categories previously established. This will allow a better understanding of how municipalities compare to Canadian averages, and the proportion of households that fall into each household income category. This will also allow for a better understanding of drop-off levels between total households and the number of units required to meet anticipated need or demand in each category. Housing tenures allow for the comparison of renter and owner-occupied households experiences and is important for understanding a community’s housing context.
Using a stratified, income-based approach to assessing current housing needs can enable communities to target new housing development in a broader and more inclusive and equitable way, resulting in housing that can respond to specific households in core housing need. This is shown in the next section.
| *Total number of households included in the Income categories totals 1,151,790 while total households in 2021 totaled 1,160,892. This is due to a small number of households who are excluded from Statistics Canada reporting on household income as they did not report income for 2020.
**Indicates where municipalities will have to source the data. |
||
| Characteristic | Data | Value |
|---|---|---|
| Total number of households | 2016 | 1,112,929 |
| 2021 | 1,160,892 | |
| Household income (Canadian dollars per year), 2020 | Average | 121,200 |
| Median | 84,000 | |
| Tenant Household Income (Canadian dollars per year - Data for City of Toronto (C), Ontario, 2020 | Average | 79,500 |
| Median | 64,000 | |
| Owner household income (Canadian dollars per year. Data for the City of Toronto (C), Ontario, 2020 | Average | 161,600 |
| Median | 111,000 | |
| Average household size (Number of members) | Total | 2.4 |
| Breakdown of household by size (Number of households) | Total | 1,160,895 |
| 1 person | 385,765 | |
| 2 persons | 353,415 | |
| 3 persons | 178,225 | |
| 4 persons | 147,360 | |
| 5 or more persons | 96,120 | |
| Tenant households (Number of households), 2021 | Total | 602,925 |
| Percentage | 48.1% | |
| Owner households (Number of households), 2021 | Total | 602,925 |
| Percentage | 51.9% | |
| Percentage of tenant households in subsidized housing, 2021 | Percentage | 14.2% |
| Households within 800m of a higher-order/high frequency transit stop or station (#)* | Total | 463,014 |
| Number of one-parent families, 2021 | Total | 152,635 |
| Percentage | 20.8% (as a percentage of total number of Census families in private households) | |
| Number of one-parent families in which the parent is a woman+ | Total | 127,560 |
| Number of one-parent families in which the parent is a man+ | Total | 250,075 |
| Number of households by all Income Category** | Very Low (up to 20% below Area Median Household Income (AMHI)) | 55,215 |
| Low (21% - 50% AMHI) | 206,085 | |
| Moderate (51-80% AMHI) | 200,735 | |
| Median (81% - 120% AMHI) | 229,410 | |
| High (>120% AMHI) | 460,345 | |
In 2021, the number of Toronto households stood at 1,160,890, growing 4.3 per cent since 2016. Toronto households consist of 60.3 per cent family households and 39.7 per cent non-family households. Approximately one in five family households are lone-parent households. Almost half of Toronto households rented their homes in 2021. Many renters in the city include newcomers, people belonging to racialized groups, and households with very low to moderate incomes that cannot afford to a buy a home in Toronto’s housing market. Approximately half of renter households are comprised of individuals living alone (41 per cent) or roommate households (10 per cent). One in seven renter households live in subsidized housing.
In 2021, the median total household income in Toronto was $84,000, an increase of about $18,000 since 2016. More than one in five households have low or very low household incomes. Renter households had a median household income in 2020 that was 42 per cent, or $47,000, lower than households who own their homes.
*We recognize that some municipalities may not have this data available at the time of completion, but encourage them to do their best in addressing this question. Municipalities will be expected to build this expertise in subsequent iterations of their Housing Needs Assessments.
Between 2016 and 2021, the formation of households by younger persons (aged 20-34 years) declined slightly from 35.2 per cent to 34.8 per cent (based on headship rates). The 2021 Census year data is interpreted with caution as household arrangements were atypical during the peak of the COVID-19 pandemic. The 2021 rate of household formation is higher than it was in 2006 (33.2 per cent ). This would indicate that in the longer-term, household suppression by younger people has not worsened.
This finding is consistent with a complimentary indicator that demonstrates a declining rate of adult children living at home with parents (from 36.5 per cent in 2016 to 35.7 per cent in 2021).
As housing costs have increased significantly over the fifteen-year period from 2006 (108 per cent for ownership, 20 per cent for renters), this would outwardly suggest that higher housing costs have not deterred younger persons from forming households. However, to do so younger people are spending more of their income of housing costs (see Figure 67 in the Housing Occupancy Trends bulletin).
While there has been some outflow of younger people to other parts of the GTHA and Province, their numbers are six times smaller than the number of younger people who are moving to Toronto from other countries. New immigrants arriving to Toronto are also forming new households, spending more on housing costs than the general population. (A greater share (40 per cent) of new arrivals (post 2016) spent more than 30 per cent of their income on housing costs compared to older arrivals at 26 per cent and the non-immigrant population at 23 per cent).
How projected formation patterns are expected to be impacted over the next five to 10 years?
The results of the 2026 Census will provide a better indication of long-term trends given that household composition in the 2021 Census may have been atypical due to the COVID-19 pandemic.
Since the 2021 Census, Toronto’s population has experienced exceptional population growth, fueled by high immigration inflows. The latest 2024 population estimates from Statistics Canada show that Toronto’s population increased by almost half a million people since 2015, and that 60 per cent of that growth took place in the last two years alone. Most of this growth is from immigration, with over 125,000 net non-permanent residents arriving each year in 2023 and 2024.
While the number of net non-permanent residents is expected to be smaller in the coming years (due to the federal government’s lowered immigration targets), the attractiveness of Toronto as an arrival point for new migrants (International and Canadian), for continued education and for job opportunities points to a continued demand for housing for younger people.
The City is closely monitoring these trends. For now, it appears that younger people continue to form households at the same rate they did in the past, taking on higher housing costs to do so.
Toronto City Council adopted the HousingTO 2020-2030 Action Plan in 2019, which provides a blueprint for action across the full housing spectrum, from homelessness to rental and ownership housing to long-term care for seniors. The City’s Housing Action Plan 2022-2026 (Housing Action Plan) is focused on removing regulatory barriers and enabling both market, non-market and mixed income housing production in order to achieve or exceed the provincial housing target of 285,000 new homes over the next 10 years.
Council has enabled the application of Inclusionary Zoning (i.e. requiring affordable units in certain development projects) through its adoption of over 100 Protected Major Transit Station Areas, which is pending approval by the Ontario Minister of Municipal Affairs and Housing.
The City’s range of policy and program initiatives is aiming to increase housing supply, housing choice and affordability for current and future residents. Improved affordability should help to sustain the current household formation rates by younger people. Cultural and demographic factors also influence these housing formation rates.
Please indicate methods used to determine expected household formation, such as calculating headship rates broken down by specific age estimate impacts.
In 2023, the City of Toronto undertook a Land Needs Assessment (“LNA”) as background to the Municipal Comprehensive Review of the Official Plan. The LNA determined the quantity of land required to accommodate forecasted population, household and employment.
This includes projections of population and households by type of dwellings, considering demographic factors, immigration and mobility rates and housing occupancy trends. A cohort-component model was constructed to project the population by single years of age and sex. The projected population was translated into projected household demand based on an analysis of household headship rates by age and the occupancy rates of different types of dwellings. This resulted in demand-driven projections of housing need.
The City of Toronto monitors housing occupancy trends at every Census release, using these trends to inform long-range forecasts, such as those recently undertaken for the forementioned LNA.
(Annual Demographic Estimates: Subprovincial Areas, July 1, 2024 Statistics Canada)
| Characteristic | Data | Value |
|---|---|---|
| Number of Workers in the Labour Force | Total | 1,518,420 |
| Number of Workers by Industry (Top 10 only) | Professional, scientific and technical services | 205,880 |
| Health care and social assistance | 163,465 | |
| Retail trade | 141,575 | |
| Finance and insurance | 123,495 | |
| Educational services | 107,480 | |
| Manufacturing | 97,580 | |
| Construction | 83,035 | |
| Accommodation and food service | 82,155 | |
| Administrative and support, waste management and remediation services | 75,095 | |
| Transportation and warehousing | 67,330 | |
| Unemployment rate and participation rate (Percent) | Unemployment rate | 13.9% |
| Participation rate | 63.9% | |
| All classes of workers (Number) | Total | 1,463,580 |
| Employees (Number) | Total | 1,223,655 |
| Permanent position (Number) | Total | 1,020,130 |
| Temporary position (Number) | Total | 203,525 |
| Fixed term (1 year or more, Number) | Total | 82,620 |
| Casual, seasonal or short-term position (less than 1 year, Number) | Total | 120,905 |
| Self-employed (Number) | Total | 239,925 |
| Number of commuters by commuting destination | Within census subdivision | 514,695 |
| To different census subdivision | 0 | |
| To different census division | 132,960 | |
| To another province/territory | 1,530 | |
| Number of commuters by main mode of commuting for the employed labour force with a usual place of work or no fixed workplace address | Car, truck or van | 482,480 |
| Public transit | 207,680 | |
| Walked | 60,615 | |
| Bicycle | 15,750 | |
| Other method | 24,945 |
Results of the Toronto Employment Survey indicate that part-time workers may be more susceptible to fluctuations in the economy with larger job losses and slower recovery than more stable full-time jobs. (See the Toronto Employment Survey 2024, pp. 36-37) The increase in job precarity impacts housing affordability and thereby, housing demand. Precarious work is defined as employment that is characterized by instability, lack of protection, and socioeconomic vulnerability. Those most disproportionately represented in precarious employment include women, racialized persons, immigrants, Indigenous persons, persons with disabilities, older adults, and youth.
The proportion of part-time work has steadily increased throughout the 42 years of the Toronto Employment Survey program, peaking in 2019 with 24.9 per cent of employment categorized as part-time. The COVID-19 pandemic caused a large drop in the proportion of part-time workers, bringing it to a number not seen since 2014 at 23.2 per cent . Part-time workers lost employment at a greater rate than those with full-time employment. Despite these job losses during the pandemic years, part-time employment is still up 18.9 per cent over the past ten years, outpacing the growth in full-time work.
From 2021 to 2023, the number of part-time workers has steadily increased with an average increase of around 12,000 new part-time workers per year. However, the jump of part-time employment from 2023-2024 was more substantial as part-time workers increased by 25,710 in one year, or about a 7.2 per cent increase from 2023. However, the 2024 number of 381,620 part-time jobs is still below the peak in 2019 of 390,850 part-time jobs. Comparatively, full-time employment has exceeded 2019 numbers and only saw a modest increase in employment of 3.3 per cent from 2023.
Community and Entertainment jobs and Service jobs were most impacted by the COVID-19 pandemic, losing 35.8 per cent and 23.4 per cent of jobs respectively in 2020. Although both categories are recovering, neither have fully recovered to 2019 employment numbers. However, part-time employment in the two categories has risen at a faster rate than full-time employment, suggesting that the structure of employment within these categories may be changing (see the Table below). Community and Entertainment part-time employment increased by 23.8 per cent from 2023, and Service part-time employment increased by 7.1 per cent. Despite the increase in Community and Entertainment employment, the Community and Entertainment businesses have continued to decline in numbers. Since 2019, businesses in the Community and Entertainment sector have fallen by 14.3 per cent. Jobs in the two sectors mentioned are more likely to be impacted due to larger socioeconomic factors.
| Total Number of Part-time Employees | 2023 to 2024 | |||
|---|---|---|---|---|
| Employment Category | 2023 | 2024 | Net Change | % Change |
| Numbers have been rounded to the nearest 10. Totals and sums may differ due to rounding. | ||||
| Manufacturing & Warehousing | 9,750 | 9,500 | -250 | -2.6% |
| Retail | 68,620 | 68,980 | 360 | 0.5% |
| Service | 65,030 | 69,660 | 4,630 | 7.1% |
| Office | 90,810 | 95,110 | 4,300 | 4.7% |
| Institutional | 96,460 | 107,110 | 10,650 | 11.0% |
| Community & Entertainment | 25,240 | 31,250 | 6,010 | 23.8% |
| Total | 355,910 | 381,620 | 25,710 | 7.2% |
By NAICS sector, the greatest increases in part-time employment were seen in Management of Companies and Enterprises (64.3 per cent), Educational Services (24.8 per cent), and Arts Entertainment and Recreation (20.5 per cent). The greatest proportion of part time workers by sector were seen in Health Care and Social Assistance, Wholesale and Retail Trade, and Accommodation and Food Services.
The City is advancing work on an Inclusive Economic Development framework in partnership with key stakeholders. This work is focused on enhancing economic outcomes for Indigenous, Black, and equity-deserving communities across the City, ensuring their economic growth prospers equitably alongside the broader growth of Toronto and the regional economy.
Inclusive economic development is aligned with the principles outlined in the recently adopted Chapter One of Toronto’s Official Plan. The Official Plan is the roadmap for how Toronto will grow, and Chapter One emphasizes an inclusive planning approach that includes the principles of reconciliation, access, equity, and inclusion.
A household is considered to be in core housing need if it meets two criteria:
Housing is considered to be affordable when housing costs less than 30 per cent of before-tax household income. Housing is considered to be suitable when there are enough bedrooms for the size and make-up of the household. Housing is considered to be adequate when it is not in need of major repairs. Determining the percentage of core housing need would facilitate comparison with forecasts of population growth and household formation, in turn enabling more accurate projection of anticipated housing needs broken down by different factors such as income, household size and priority population, as explained below. It is important to note that official measures of those in core housing need exclude key groups, including those experiencing homelessness, students living independently of their guardians, people living in congregate housing, and migrant farm workers. This means that core housing need figures may underestimate overall housing need. Due to this, communities should also strive to include as much information as possible about these groups in the Priority Groups section below, in order to provide a comprehensive picture of who is affected by core housing need.
Housing Needs Assessment Tool | Housing Assessment Resource Project
| Income Category | % of Total HHs | Annual HH Income | Affordable Shelter Cost (2020 CAD$) |
|---|---|---|---|
| Area Median Household Income (AMHI) | - | $85,000 | $2,125 |
| Very Low Income (up to 20% of AMHI) | 2.04% | <= $17,000 | <= $425 |
| Low Income (21%-50% AMHI) | 17.21% | $17,001 – $42,500 | $425 - $1,063 |
| Moderate income (51% to 80% AMHI) | 18.08% | $42,501-$68,000$ | $1,063$-1,700$ |
| Median Income (81% to 120% of AMHI) | 20.81% | $68,001 - $102,000 | $1,700 - $2,550$ |
| High Income (121% and more of AMHI) | 41.86% | >=$102,001 | >= $2,551 |
Note the HART tables indicate an area median household income of $85,000, however data reported by the City in Table 3.1.1 using 2021 Census data directly supplied by Statistics Canada indicates a median before-tax household income of $84,000.
| Income Category (Max. Affordable Shelter Costs) | 1-Person HH | 2-Persons HH | 3-Persons HH | 4-Persons HH | 5+ Persons HH |
|---|---|---|---|---|---|
| Very Low Income (425$) | 86.35% | 10.66% | 2.20% | 0.49% | 0.30% |
| Low Income (1062$) | 65.73% | 23.83% | 6.74% | 2.77% | 0.93% |
| Moderate Income (1,700$) | 13.97% | 36.79% | 23.68% | 15.98% | 9.57% |
| Median Income (2550$) | 0% | 0% | 16.78% | 34.94% | 48.28% |
| High Income (>2550$) | 0% | 0% | 0% | 0% | 0% |
| Income Category (Max. Affordable Shelter Cost) | 1-Person HH | 2-Persons HH | 3-Persons HH | 4-Persons HH | 5+ Persons HH | Total |
|---|---|---|---|---|---|---|
| Very Low Income (425$) | 11,385 | 1,405 | 290 | 65 | 40 | 13,185 |
| Low Income (1062$) | 83,755 | 30,365 | 8,590 | 3,525 | 1,190 | 127,425 |
| Moderate Income (1,700$) | 9,715 | 25,580 | 16,465 | 11,110 | 6,655 | 69,525 |
| Median Income (2550$) | 0 | 0 | 855 | 1,780 | 2,460 | 5,095 |
| High Income (>2550$) | 0 | 0 | 0 | 0 | 0 | 0 |
| Total | 104,855 | 57,350 | 26,200 | 16,480 | 10,345 | 215,230 |
| Characteristic | Data | Value |
|---|---|---|
| Toronto (c): Affordability – Owner and tenant households spending 30% or more on shelter costs (# and %) | Total | 373,965 |
| Percentage | 32.5 | |
| Toronto (c) Affordability – Owner and tenant households spending 30% or more on shelter costs and in core need (# and %) | Total | 187,020 |
| Percentage | 17 | |
| Toronto (c) Affordability – Tenant households spending 30% or more of income on shelter costs (# and %) | Total | 220,490 |
| Percentage | 40 | |
| Toronto (c) Affordability – Tenant households spending 30% or more of income on shelter costs and in core need (# and %) | Total | 129,005 |
| Percentage | 11.7 | |
| Toronto (c) Affordability – Owner households spending 30% or more of income on shelter costs (# and %) | Total | 153,475 |
| Percentage | 25.6 | |
| Toronto (c) Affordability – Owner households spending 30% or more of income on shelter costs and in core need (# and %) | Total | 58,010 |
| Percentage | 5.3 | |
| Toronto (c) Adequacy – Owner and tenant households in dwellings requiring major repair (# and %) | Total | 74,475 |
| Percentage | 6.4 | |
| Toronto (c) Adequacy – Owner and tenant households in dwellings requiring major repair and in core need (# and %) | Total | 26695 |
| Percentage | 2.4 | |
| Toronto (c) Adequacy – Tenant households in dwellings requiring major repairs (# and %) | Total | 43,465 |
| Percentage | 7.8 | |
| Toronto (c) Adequacy – Tenant households in dwellings requiring major repairs and in core need (# and %) | Total | 19,995 |
| Percentage | 1.8 | |
| Toronto (c) Adequacy – Owner households in dwellings requiring major repairs (# and %) | Total | 31,015 |
| Percentage | 5.1 | |
| Toronto (c) Adequacy – Owner households in dwellings requiring major repairs and in core need (# and %) | Total | 6700 |
| Percentage | 0.6 | |
| Toronto (c) Suitability – Owner and tenant households in unsuitable dwellings (# and %) | Total | 144,545 |
| Percentage | 12.5 | |
| Toronto (c) Suitability – Owner and tenant households in unsuitable dwellings and in core need (# and %) | Total | 41,205 |
| Percentage | 3.8 | |
| Toronto (c) Suitability – Tenant households in unsuitable dwellings (# and %) | Total | 105,590 |
| Percentage | 18.9 | |
| Toronto (c) Suitability – Tenant households in unsuitable dwellings and in core need (# and %) | Total | 35,635 |
| Percentage | 3.2 | |
| Toronto (c) Suitability – Owner households in unsuitable dwellings (# and %) | Total | 38,960 |
| Percentage | 6.5 | |
| Toronto (c) Suitability – Owner households in unsuitable dwellings and in core need (# and %) | Total | 5,575 |
| Percentage | 0.5 | |
| Toronto (c) Total households in core housing need | Total | 215,225 |
| Toronto (c) Percentage of tenant households in core housing need | Percentage | 29.3 |
| Toronto (c) Percentage of owner households in core housing need | Percentage | 10.8 |
In Toronto, approximately one out of every five households (215,225 households) met the core housing need designation (19.6 per cent). The majority (71 per cent) of these households in core housing need are renters. 40 per cent of renter households spent over 30 per cent of their income on housing costs. In 2020, there were 160,150 households spending 50 per cent or more of their income on shelter costs. Renter households were also more likely to live in housing that was crowded or in need of major repairs. In 2020, almost a third of all households were living in unaffordable housing.
There are 12 groups that CMHC defines as priority populations for affordable homes: groups who face a proportionally far greater housing need than the general population. There is also a 13th group, women-led households and specifically single mothers, implied in the National Housing Strategy which targets 33 per cent (with a minimum of 25 per cent) of funding going to housing for women-led households. Priority population groups are:
Census data does not disaggregate core housing need data by all priority populations, including veterans, individuals who identify as LGBTQ2S+, survivors of domestic violence, and individuals experiencing homelessness. Many households may have members in multiple priority categories which may also not be represented in the data. With these limitations in mind, information on housing need by priority population would be helpful for developing inclusive housing policies.
Data provided by HART indicates that households led by a member belonging to 10 of the 12 CMHC priority populations noted above have higher core housing need rates than the general population. Approximately 19.6 per cent of all households in Toronto are in core housing need, and this rate is significantly higher for lone-parent, women-led households (31.9 per cent ) and households where the primary maintainer is a refugee claimant (29.9 per cent), or is Black (29.6 per cent). It should be noted that the core housing need rates published by HART refers to priority populations in either rented or owned dwellings. These rates are likely significantly higher for each priority population when looking specifically at renter households, as renters in general have core housing needs that are notably higher than the overall population.
| Priority Population, Based on the Primary Household Maintainer | % in CHN |
|---|---|
| Lone-parent woman | 31.87% |
| Women | 23.05% |
| Indigenous | 22.65% |
| Racialized group | 21.26% |
| Black | 29.58% |
| New Migrant | 22.81% |
| Refugee-Claimant | 29.95% |
| Under-25 | 24.30% |
| Age 65+ | 23.16% |
| Age 85+ | 26.23% |
| Physical activity limitation | 18.26% |
| Cognitive, mental or addictions related activity limitation | 17.08% |
| Gender-diverse (trans) | 18.91% |
| Community (All) | 19.57% |
The City of Toronto declared homelessness an emergency in May 2023, and continues to experience a homelessness crisis, as demonstrated by significant demand for emergency shelter services. Toronto’s shelter system is the largest in Canada. The homelessness service system has been working tirelessly to try to meet growing demand. The City has more than doubled our bedded capacity since 2016. Despite this, the current demand for shelter space is so high that every night the City is unable to provide shelter to hundreds of people requesting space; and those who do have a space may not have the supports they need to stabilize and exit shelter.
As of May 11, 2025, the City is accommodating 9,801 individuals receiving accommodation from City homelessness programs. This includes 9,193 people in the shelter system, as well as 608 people (in families) who are in bridging/triage programs, awaiting a space in the shelter system. As of May 11, 2025, the City was providing accommodation supports to 4,053 refugee claimants experiencing homelessness, with 3,976 people in the shelter system, and 77 people in bridging/triage programs accounting for 41 per cent of all people provided with accommodation.
Toronto’s homelessness service system serves a range of equity-deserving groups, including people experiencing chronic homelessness, seniors, low-income households, people with disabilities, Indigenous people, Black people, refugee claimants, 2SLGBTQ+ people, women, and youth. In March 2025, over 7,000 individuals who had actively experienced homelessness during the past three months were chronically homeless.
Toronto is one among many cities across Canada which continues to see a rise in homelessness, both sheltered and unsheltered, including people living in encampments. Encampment activity is often seasonal, as of May 2, 2025, there were 265 encampments across the city.
The City’s homelessness crisis is occurring for many reasons, including the ongoing housing affordability crisis, mental health and opioid poisoning crisis, insufficient wages and income supports that have not kept pace with the rising cost of living, and limited response coordination at the provincial and national level and limited options record number of refugee claimants seeking emergency shelter. Continued erosion of housing affordability has meant that individuals experiencing homelessness are having to stay longer in shelter programs. In 2011, nearly five unique shelter users were able to use a shelter system bed per year. In 2024 that figure is just above two unique shelter users.
Toronto’s shelter system will accommodate 12,235 individuals per night in 2025 in the shelters as well as in bridging hotels. Toronto’s shelter system is full. Current demand for shelter space is so high that every night the City is unable to provide shelter to hundreds of people requesting a space. As of May 4, 2025, an average of 157 individuals per day could not be matched to shelter space. There are an additional 216 families on the family shelter placement list waiting for a space in the family shelter system. As a result, the City is experiencing increasing levels of homelessness on the street, in encampments and on the City’s transit system.
In Toronto, it is estimated that over 350,000 students are enrolled in public academic institutions. In recent years, an increasing number of post-secondary students have been struggling to meet their basic needs for housing, food, and other life necessities. The higher costs of living, coupled with financial assistance programs that do not reflect increasing costs, are leaving more students financially stretched and overwhelmed. While this is a national trend, it is more prevalent in Toronto, where housing costs are already some of the highest in the country. As a result, more post-secondary students are relying on food banks and homelessness services; they are more likely to experience precarious housing situations and live in over-crowded homes; and are increasingly more vulnerable to housing scams and fraud.
Students are competing for an already limited supply of rental homes that can be expensive for them. For example, average asking rents for a vacant studio apartment in Toronto was $1,880 in October 2024, making it affordable to an individual earning at least $75,200 per year. The average asking rent for a vacant two-bedroom rental apartment was $2,744 in October 2024, which if shared equally between two individuals, would require each tenant to earn $55,000 per year to be able to afford the rent (at 30 percent of their before-tax income). The Ontario Student Assistance Program (OSAP) provides a maximum of $520 per week to single students with no dependents. Full-time international students are currently allowed to work up to 24 hours a week during school year (and full time during academic breaks). Given the variety of factors impacting the earnings of post-secondary students, there is limited data on how much post-secondary students earn on an annual basis however, according to a national survey held in 2021, majority of university of students have an income of $20,000 or less per year.
Between October 2024 and January 2025, the City of Toronto undertook an extensive consultation to capture the experiences, insights, and ideas for action from nearly 2,000 people—primarily students—across public colleges and universities in Toronto. Approximately 82 percent of student respondents live off-campus, with only 10 per cent residing in on-campus housing and eight per cent in other housing arrangements. Among off-campus students, the most common living situations include renting from private landlords (33 per cent), living permanently with family (24 percent), and renting in shared accommodation e.g. multi-tenant houses (17 per cent). This is consistent with the FLASH national survey of over 18,000 students across Canada which showed 61 per cent of the student respondents rent on the private market and six percent live in university residences provided by their academic institutions or private providers.
Some of the key themes that arose from these consultations were:
This section should tell a story of housing changes over time in a community through trends in net change of affordable or below-market housing. This should be expressed through illustrations of net losses or net gains in affordable and non-market housing over the previous three census periods.
As the most populous city in Canada and the economic focal point of southern Ontario, Toronto maintains a competitive position as a business location and reflects the diversity and strength of the broader regional economy. Toronto has evolved as the focal point for specialized services for the whole region, in fields as diverse as education, health, culture, entertainment, tourism and retailing. The City’s 2024 Toronto Employment Survey recorded 1,600,300 jobs citywide, a new all-time high for the program.
The city’s housing growth has also been shaped by investments in transit. All orders of government are currently making substantial investments in transit expansion in Toronto. Through their transit-oriented communities (“TOC”) program, the Province is creating the opportunity for third-parties to also make investments in transit infrastructure and to integrate transit infrastructure with new development in various locations, thereby bringing more housing and jobs closer to transit.
As a result, Toronto has experienced significant residential and non-residential development in recent decades. The City’s 2023 Development Pipeline contained 800,889 residential units, the highest ever recorded. This is 129,928 more units than the five-year window to 2021, representing growth of 19 per cent in the near-term housing supply. From 2019-2023, 106,071 units were built as a result of Planning approvals and downstream Building Permits, an average of 21,214 units per year. A mix of housing options, including rental and ownership tenure, is important for meeting the needs of a diverse city like Toronto. Condominium ownership units continue to be the predominant tenure for proposed residential units in the Pipeline, however the number of proposed purpose-built rental units is increasing.
However economic pressures resulting from rising construction costs and interest rates, an aging construction workforce, and population growth have constrained housing supply within this development pipeline from being fully unlocked. Housing starts in 2024 in the city of Toronto were notably lower than 2022 and 2023, indicating an expected slowdown in development of new housing.
| *Indicates where municipalities will have to source the data. | ||
| Characteristic | Data | Value |
|---|---|---|
| Total private dwellings | Total | 1,160,890 |
| Breakdown by structural types of units (number of units) | Single-detached | 270,490 |
| Semi-detached | 71,955 | |
| Row house | 62,915 | |
| Apartment/flat in a duplex | 47,810 | |
| Apartment in a building that has fewer than 5 storeys | 162,245 | |
| Apartment in a building that has 5 or more storeys | 542,625 | |
| Other single attached | 2,770 | |
| Movable dwelling | 85 | |
| Breakdown by size (number of units) | Total | 1,160,890 |
| No bedrooms | 28,765 | |
| 1 bedroom | 330,340 | |
| 2 bedrooms | 334,320 | |
| 3 bedrooms | 268,505 | |
| 4 or more bedrooms | 198,960 | |
| Breakdown by date built (number of units) | Total | 1,160,890 |
| 1960 or before | 340,185 | |
| 1961 to 1980 | 333,990 | |
| 1981 to 1990 | 109,780 | |
| 1991 to 2000 | 92,985 | |
| 2001 to 2005 | 58,975 | |
| 2006 to 2010 | 63,995 | |
| 2011 to 2015 | 75,980 | |
| 2016 to 2021 | 85,005 | |
| Rental vacancy rate (Per cent) 2024 | Total | 2.3 |
| Bachelor | 4.5 | |
| 1 bedroom | 2.7 | |
| 2 bedrooms | 1.7 | |
| 3 bedrooms+ | 1.3 | |
| Number of primary and secondary rental units (2021) | Primary | 269,975 |
| Secondary* | 208,768* | |
| Number of licensed and active short-term rental units, March 2025* | Total* | 8,506* |
The City does not have data on the exact number of units affordable to low and very low income households lost between 2020 and 2024. However external sources have analyzed data from the 2016 and 2021 Census periods to estimate the total number of rental units in the City of Toronto charging under $1,000 per month that were lost. The City estimates that 1,002 new homes that are affordable to low-income or very-low income were built during the same period, based on projects supported by the City’s affordable housing programs.
Average market rents have increased by an average of 4.9 per cent annually in the last ten years although the city saw a much lower rate of increase from 2023 to 2024 (increased by only 0.3 per cent) compared to the rate seen in previous years. For example, the average market rent increased by 10 per cent from 2022 to 2023 and by 6.4 per cent from 2021 to 2022.
Factors that have contributed to the increase in average rents in Toronto include the limited supply of rental units, particularly purpose-built rental units, in the city. This limited supply is partly due to the lower profitability of rental housing compared to condominiums, the lack of government support for purpose-built rental housing construction until recently, and a lengthy development process.
The growth of the city’s population has also contributed to the rise in average rents due to a demand for rental housing. Toronto is a major economic and cultural hub which attracts a larger share of immigrants from both outside of, and within, Canada. Recent immigrants, including international students, generally rent their homes, which increases demand and puts pressure on the rental market. However, the introduction of a cap on international student intake in July 2024 and a decrease in immigration targets for 2025-2027 is likely to decrease the demand for rental units in the city.
The continuous rise in house prices has resulted in an increase in demand for rental housing. Despite a slight decline in house prices in recent months as well as lower mortgage rates, renting remains the more affordable option for many households in Toronto. The rise in other non-housing costs make it more of a challenge for households to save for a down payment and/or to qualify for a mortgage, leading many renters to stay in the rental market. Other households may choose to rent to remain close to their jobs in the city, although this may have less of an impact since the pandemic and the rise of work from home and hybrid work arrangements.
The increase in average rents is also influenced by amenities and services that are being included in newer purpose-built rental units as well as upgrades to modernize older purpose-built rental stock.
Average rents in 2024 saw the lowest year-over-year increase in the last ten years, increasing by less than one per cent from 2023 to 2024. This lower rate of increase in overall average rents from 2023 to 2024 is partly due to the recent increase in supply of rental housing. Some of this supply comes from an increase in condominium units that are being rented out, both newly built and existing condominium rental units. There has also been an increase in the purpose-built rental housing supply in the last two years. In 2023, CMHC reported 4,975 new apartment rental completions, up from 2,109 in 2022. In 2024, there were 4,548 apartment rental completions. This new supply has helped ease the pressure on the rental market and provided tenants, particularly middle- and higher-income tenants, with more choice. While the supply has resulted in a slower rate of increase in rents, the average rents remain unaffordable for many lower-income tenants in Toronto.
The overall vacancy rate for purpose-built rental units in Toronto increased from 1.4 per cent in 2023 to 2.3 per cent in 2024. This is slightly above the 10-year historical average of 2.1 per cent but still below what is considered a balanced rate of three per cent. The factors impacting average rents discussed above also affect rental vacancy rates. In particular, the recent increase in supply, both of purpose-built and condominium rental units, has provided tenants with more rental housing options and existing landlords with more competition.
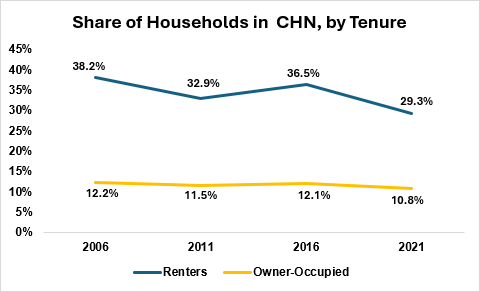
Core Housing Need (CHN) rates for both owner and renter households declined in 2021 compared to 2016, with 29.3 per cent of renter households in CHN and 10.8 per cent of owner-occupied households. These rates have also declined from 2011 CHN rates, however, the 2021 Census (May 11, 2021) took place at the peak of the COVID-19 pandemic, and hence caution must be applied when comparing the 2021 data to previous census year or when interpreting the 2021 data as indicating long term trends Specifically in the context of households in CHN, the impact of emergency benefits such as the Canada Emergency Response Benefit (CERB) as well as the migration away from small units in city centers should be taken into consideration. Given more recent trends since 2021 in Toronto of increasing rents and home prices, the City anticipates that the Core Housing Need rate for both owner and renter households will increase in 2026 above 2021 and 2016 levels.
| *Indicates where municipalities will have to source the data. | ||
| Characteristic | Data | Value |
|---|---|---|
| Number of housing units that are subsidized, 2021* | Total | 78,820 (Source: 2021 Census)* |
| Number of housing units that are below market rent in the private market (can either be rent or income-based definition), 2024* | Total | At least 81,592 (based on total number of units in the rental universe in 2024 that were charging rents affordable to the first and second income quintiles), source: CMHC 2024 Rental Market Supply Report)* |
| Number of co-operative housing units, 2023* | Total | 33,978 Source: CMHC 2023 Social and Affordable Housing Survey (custom data for Toronto CSD)* |
| Number of other non-market housing units (permanent supportive, transitional, etc.), 2024* | Total | 92,882, which incudes subsidized units noted above, as well as other non-market affordable homes. Source: City of Toronto internal data* |
Examples can include:
As part of the 2020-2030 HousingTO Action Plan, the City has set a target to approve 47,500 affordable homes, including 6,500 deeply affordable homes, The City has also set a target of approving the development of 18,000 supportive homes during this same ten-year period.
In recognition of the need to support priority populations, as part of the 10-year HousingTO Plan the City has set a target of approving at least 10,000 new homes that are intended for women-led and gender-diverse households, and 5,200 homes that are delivered by Indigenous housing providers and for Indigenous-led households. To support seniors, the City has set a target of creating 1,500 new non-profit long-term care beds.
In addition, the City has set a target to improve housing affordability for 40,000 renter households by providing housing allowances, and housing benefits through the Canada-Ontario Housing Benefit (COHB), a portable housing benefit that helps people obtain and afford housing in the private market, which is funded jointly by the federal and provincial governments and for which the City identifies and supports eligible applicants. COHB is prioritized to support access to permanent housing for individuals and families experiencing homelessness.
| *Indicates where municipalities will have to source the data. | ||
| Characteristic | Data | Value |
|---|---|---|
| Median monthly shelter costs for rented dwellings (Canadian dollars, 2020) | Median | $1,500 |
| Purpose-built rental rents by unit size (Average, Canadian dollars, 2024) | Total | $1,851 |
| Bachelor | $1,456 | |
| 1 bedroom | $1,715 | |
| 2 bedrooms | $1,984 | |
| 3 bedrooms+ | $2,232 | |
| Purpose-built rental prices by unit size (Median, Canadian dollars per month, 2024) | Total | $1,760 |
| Bachelor | $1,450 | |
| 1 bedroom | $1,699 | |
| 2 bedrooms | $1,917 | |
| 3 bedrooms+ | $2,000 | |
| Sale prices (Canadian dollars, YTD 2024, all housing types)* | Average | $1,107,233 |
| Median | $880,000 | |
| Sale prices by unit size, new condominiums (Average, Canadian dollars, 2020)* | Average | $1,096,620 |
| Bachelor | $439,650 | |
| 1 bedroom | $488,500 | |
| 2 bedrooms | $732,750 | |
| 3 bedrooms+ | $928,150 | |
| Sale prices by unit size (Median, Canadian dollars, Q4 2024)* | Median | $622,000 (median prices by unit type not available) |
| Bachelor | - | |
| 1 bedrooms | - | |
| 2 bedrooms | - | |
| 3 bedrooms+ | - | |
| *Indicates where municipalities will have to source the data. | ||
| Characteristic | Data | Value |
|---|---|---|
| Demolished – breakdown by tenure* | Total | 1,781 – unable to break down by tenure |
| Completed – Overall and breakdown by structural type (annual, number of structures) | Total | 346,220 |
| Single | 88,868 | |
| Semi-detached | 13,535 | |
| Row | 45,060 | |
| Apartment | 198,757 | |
| Completed – Breakdown by tenure (annual, number of structures) | Total | 164,480 |
| Completed – Breakdown by tenure (annual, number of structures) | Tenant | 16,034 |
| Owner | 15,669 | |
| Condo | 132,744 | |
| Coop | 33 | |
| Housing starts by structural type and tenure* | Total | 243,910 |
This section projects population trends from the previous 10 years, dividing by income category and target housing costs while considering migration trends. An example of a benchmarked projection from Edmonton’s Affordable Housing Needs Assessment is provided below.
HNAs should be able to convey through their data-driven narrative how many housing units are needed by income category, household size and dwelling type over the next 10 years. In completing this section, communities must carefully consider their past growth trends and future demographic projections, including recent immigration patterns, aging population dynamics, and economic trends. Furthermore, it is also crucial for communities to consider any pre-existing housing shortages, as evidenced by indicators such as recent trends in rental vacancy rates, growth in prices/rents, the number of households in core housing need, and the aging of their current housing stock.
There are several projection methodologies that can be used to project housing demand, including the HART housing needs projection. The federal government recommends using the HART methodology as a reference point, with additional considerations and data points to improve the validity of the methodology. These considerations, including economic data integration and supply capacity and gaps as well as steps for calculating the methodology are noted below. Provinces and territories, in consultation with their municipalities/communities, are invited to use a methodology that fits their regional circumstances, ensuring the assumptions that inform their preferred methodology are also clearly explained. The federal government will review the HNAs as a requirement for its various funding programs and assess the methodology and assumptions that inform it for their validity and robustness. If needed, further engagements can take place to better align the preferred methodology with the federal government’s expectations.
In employing a projection methodology, jurisdictions may find the following list of key considerations and steps useful. The following approach involves first projecting the population into the future, then projecting household formation from headship rates, and then demand for housing by tenure, dwelling type and size, family type and income groups. Following the Population Projection, Household Projection and Housing Demand Projection steps, a table is presented of the key considerations for each step in the process.
| *Indicates where municipalities will have to source the data. | ||||||
| HH Income Category | 1 person | 2 person | 3 person | 4 person | 5+ person | Total in 2031 |
|---|---|---|---|---|---|---|
| Very Low Income* | 53,542 | 9,021 | 625 | 0 | 0 | 62,602 |
| Low Income* | 159,445 | 59,459 | 11,512 | 2,586 | 0 | 231,796 |
| Moderate Income* | 89,169 | 80,637 | 30,816 | 14,598 | 7,236 | 228,018 |
| Median Income* | 76,550 | 86,256 | 45,873 | 30,040 | 17,972 | 251,126 |
| High Income* | 62,183 | 166,001 | 102,623 | 106,623 | 69,907 | 506,921 |
| Total* | 440,889 | 401,369 | 191,449 | 153,434 | 95,115 | 1,280,463 |
To project housing demand by tenure:
To project housing demand by dwelling type:
The City of Toronto has its own method of calculating projections that is separate from the HART methodology outlined in the Housing Needs Assessment. As a result, the values provided in tables 6.2.1, 6.3.1 and 6.3.2 of the Housing Needs Assessment do not necessarily feed into each other. The values provided in these tables are largely derived from analysis the City of Toronto completed for its Land Needs Assessment (LNA). Adopted by the Planning and Housing Committee of Toronto City Council on April 13, 2023, the LNA was a provincially mandated study to determine the quantity of land required to accommodate forecasted population, household and employment growth to 2051.
The City of Toronto has its own method of calculating projections that is separate from the HART methodology outlined in the Housing Needs Assessment. As a result, the values provided in tables 6.2.1, 6.3.1 and 6.3.2 of the Housing Needs Assessment do not necessarily feed into each other. The values provided in these tables are largely derived from analysis the City of Toronto completed for its Land Needs Assessment (LNA). Adopted by the Planning and Housing Committee of Toronto City Council on April 13, 2023, the LNA was a provincially mandated study to determine the quantity of land required to accommodate forecasted population, household and employment growth to 2051.
Below is a brief description of the calculations involved in the LNA. More detail about the LNA methodology can be found in the staff report that was presented to the Planning and Housing Committee of Toronto City Council. Components of the Housing Needs Assessment that were not covered by the LNA are described below. Projected values for the Housing Needs Assessment are for 2031.
For the LNA, a cohort-component model was constructed to project the population by single years of age and sex to 2051. The population forecast in Schedule 3 of the Growth Plan, and supporting forecasts in the Technical Report by Hemson Consulting Ltd, were used as control totals. (See Attachment 2 of the LNA staff report for the detailed methodology.) The projection timeframe was thirty-five years, for each five-year period from 2016 to 2051 with 2016 as the base year and 2021 as the first projection year. The demographic projections were adjusted to correspond to the Growth Plan population forecast as well as other scenarios. The estimated Census net undercount was included.
Information on births and deaths were converted into one-year and five-year mortality rates and smoothed using curve-fitting analysis to produce mortality rates and trends applicable over the projection horizon.
Population cohorts were multiplied by their respective survivorship rates to yield a surviving population in subsequent time periods. Age-specific survivorship rates were created, representing the proportion of the population remaining after the mortality rate was applied. This determined how many people of a given age survive into the next projection period. Age-specific five-year survivorship rates were applied to all age cohorts.
The cohorts of the female population of childbearing age were multiplied by the respective fertility rates to yield numbers of live births. A smoothed curve was estimated for 2016 and projected to 2046. These were multiplied by one-year survivorship rates to calculate net natural increase for those zero to four years of age.
To arrive at a base migration rate, net migration for each age cohort was first estimated by comparing the difference between the 2011 population projected via natural increase and the 2016 actual counts for population and migration. In-migration from other parts of Canada and other parts of the world is captured by the Census, as is outmigration to other parts of the province and the country. The Census cannot capture emigration which instead is inferred as the difference between the two sets of actuals. Emigration is the difference between the 2011 population projected via natural increase and the 2016 actual counts, less net migration. Once estimated, an out-migration rate was calculated for single years of age and used for the projection period. For each age cohort, out-migration was the surviving population of the cohort five years younger in the prior time period multiplied by the 2011-2016 out-migration rate.
To determine whether or not there was sufficient residential potential to accommodate the forecasted growth in the City, household projections were developed as part of the LNA to represent the demand for housing. Along with the analysis of the City’s residential potential, this enabled the construction of a reasonable model of how and when the forecasted population could be accommodated within the City in accordance with Official Plan policies, over the thirty-five years from 2016 to 2051.
Housing occupancy statistics and trends over the past twenty years based on Statistics Canada data were used to convert the projected population into projected city-wide demand for housing by dwelling type and tenure for each five-year period to 2051. The analysis was informed by the trends observed in two research bulletins:
First, the projected population in occupied private dwellings was calculated by multiplying the age-specific projected population by the 2016 age-specific ratio of people living in private dwellings. Next, the overall number of households by age was projected by multiplying the projected population in occupied private dwellings by age by 2016 age-specific headship rates.
To match the guidance in the LNA Methodology as closely as possible, households were projected by five different dwelling types:
The household projections by dwelling type were calculated by multiplying the projected age-specific population in private dwellings by the age- and dwelling-type-specific headship rates.
Condominium units can be occupied by their owners, or they can be rented out to another household. Therefore, the tenure types explored in the LNA analysis and the analysis of Housing Occupancy Trends 1996-2016 included the tenure of households by condominium status as follows:
The household projections by tenure were calculated by multiplying the projected age-specific population in private dwellings by the age- and tenure-specific headship rates.
For both the household projections by dwelling type and by tenure, additional calculations were undertaken to account for recent trends that are expected to continue, such as declining average household sizes and increasing proportions of unit completions consisting of apartments in buildings of five or more storeys, small units, and condominiums. This resulted in demand-driven projections of housing need. The detail of the projections by tenure at the early stage of the LNA Projections was superseded by the locational specifics of the potential housing supply from the various sources of supply.
The LNA did not project households by household type. Therefore, for the Housing Needs Assessment exercise, projected family and non-family households were calculated by multiplying the projected households in 2031 by the 2021 ratios of family and non-family households respectively from the Housing Occupancy Trends 2021 analysis, extrapolated to 2031 to account for the trend in declining family household headship. Note that the LNA was based on the 2016 Census and was informed by the City’s Housing Occupancy Trends 1996-2016 research bulletin.
The LNA projections were based on persons per household values rather than headship rates. Therefore, for the Housing Needs Assessment exercise, headship rates were calculated by carrying forward the 2021 headship rate to 2031.
This value was calculated by subtracting the number of households in the 2021 Census from the projected number of households in 2031.
These values are based on historical occupancy trends as opposed to dwelling choice. This analysis was informed by the City’s Housing Occupancy Trends 1996-2016 research bulletin.
Households were projected by five-year age cohorts in the LNA. The projected average household age calculation involved two steps. In the first step, the projected 2031 households by age was multiplied by the median age of each five-year cohort. For example, the median age in the first cohort, 15-19 is 17.5. This number was multiplied by the projected number of households led by Primary Household Maintainers aged 15-19, 3,570. This calculation was repeated for every age cohort. The median of the oldest age range, 85+, was assumed to be 89 to account for the fact that this range includes households aged in their 90s and beyond but that there are more households at the younger end of the range. In the second step, the products for each age cohort was summed and that sum was divided by the total projected number of households for all ages.
The projected median household age is calculated as the approximate midpoint of the cumulative frequency of households by age. First, the projected number of households in each successive age cohort in 2031 was summed (i.e. households aged 15-19 plus households aged 20-24, etc.). Then the midpoint of the total number of projected households was calculated. That midpoint fell between the cumulative frequencies of two different age group categories for 2031 (45-49 and 50-54), meaning that the midpoint includes some but not all of the households aged 50-54. To estimate where that midpoint fell within that five-year age range, the cumulative frequency of the next lowest age category below the midpoint (45-49) was subtracted from the midpoint value. This value was then calculated as a percent of the difference between the cumulative frequencies of the two midpoint-adjacent age categories (45-49 and 50-54). That percentage was then added to the lowest age in the 50-54-year age category to obtain an estimate of the median household age for 2031.
These values come from Table 6.1.1.
This value represents the projected population divided by the projected households for 2031, with additional adjustments to account for the trend of declining average household sizes that had been projected across the projection time horizon, further adjusted for the composition of the anticipated housing supply.
Through the LNA, potential housing supply was identified from a variety of sources including current development proposals that represent market-based demand, as well as remaining residential potential within Official Plan growth management areas, major redevelopment opportunities, as-of-right construction and estimated demolitions. An integrated housing supply model was constructed, combining the various sources of potential supply by location, dwelling type, time period and likelihood. The utilization of the potential supply was driven by the projected household demand by dwelling type in each period that was to be accommodated. This was used to identify the distribution of potential housing across the city over time by type of dwelling.
Figures are from the LNA household projections based on the composition of the anticipated housing supply. For supply by dwelling type, and given the composition of the potential housing supply, the LNA grouped dwelling types into two categories: apartments in buildings with five or more storeys and ground-related (all other dwelling types including apartments in buildings with fewer than five storeys).
The LNA projected units by structural type of dwelling and did not project units by number of bedrooms; however, the City of Toronto’s Right-Sizing Housing and Generational Turnover bulletin estimated future demand for housing by number of bedrooms. Therefore, to align with the overall household projections calculated in the LNA, the projected households by number of bedrooms was calculated for the Housing Needs Assessment by applying the proportion of estimated households by bedroom type calculated in the Right-Sizing bulletin to the total projected households calculated for the LNA. This analysis assumes that the demand for bedrooms will remain consistent by age in the future, and that the number of units demanded in future by number of bedrooms will be matched by the supply of units by bedrooms. The Right-Sizing bulletin estimated demand separately for studios (i.e. units without bedrooms) and one-, two-, three-, and four-or-more bedroom units, so the values provided in table 6.3.2 group studios and one-bedroom units together and group four- and five-or-more bedroom units together.
These measures do not apply to the City of Toronto as the city is fully urbanized with no greenfield area. All development within the city is intensification, including the redevelopment and gentle intensification of existing subdivided land. The large majority of the proposed development in the city consists of apartments in buildings with five or more storeys as opposed to ground-related lots. The potential for ground-related intensification is increasing through a variety of changes to housing policy and zoning regulation e.g. through the Expanding Housing in Neighbourhoods initiatives. The relevant measures are provided above in Table 6.3.2 regarding anticipated units.
| *Indicates where municipalities will have to source the data. | ||
| Characteristic | Data/Formula | Value |
|---|---|---|
| Women by age distribution (# and %)* | 0-14 | 244,430 |
| 15-19 | 81,180 | |
| 20-24 | 87,855 | |
| 25-64 | 891,835 | |
| 65-84 | 304,510 | |
| 85+ | 69,715 | |
| Male Births* | Births x Estimated Proportion of Male Births | 170,392 |
| Female Births* | Total births – Male Births | 161,253 |
| Survival Rate* | Survival rate for those not yet born at the beginning of the census year | Average 5year Rates:
2021, 2026 Males: 0.9996 Females: 0.9994 |
| Net Migrations* | Net migration (in and out) of those not yet born at the beginning of the census year | 61,401 |
| Projected Family Households* | Age-group population x projected age-specific family headship rate | 817,864 |
| Projected Non-family Households* | Age-group population x projected age-specific non-family headship rate | 610,301 |
| Total Projected Headship Rate* | Family headship rates + non-family headship rates | 42.0% |
| Projected Net Household Formation* | Projected households by type (family and non-family) (Year 2) – Projected households by type (family and non-family) (Year 1) | 267,270 |
| Projected Owner Households* | Projected households by type, year and age group x Projected ownership rate by type, year and age group | 764,280 |
| Projected Renter Households* | Projected households by type, year and age group – projected owner households by type, year and age group | 659,890 |
| Projected Dwelling Choice* | Projected households by type, tenure and age group x projected dwelling choice propensities by type, tenure and age group | 364,965: Singles & Semis
71,395: Row houses 57,335: Duplex/Other 189,400: Apartments in buildings with fewer than five storeys 745,070: Apartments in buildings with five or more storeys |
| *Indicates where municipalities will have to source the data. | ||||||
| Characteristic | Data | Value | ||||
|---|---|---|---|---|---|---|
| Anticipated population* | Total | 3,184,660 without undercoverage
3,287,055 with undercoverage |
||||
| Anticipated population growth* | Total | 245,145 without undercoverage
243,025 with undercoverage |
||||
| Percentage | 8.34% | |||||
| Anticipated age* | Average | 42.7 | ||||
| Median | 41.4 | |||||
| Anticipated age distribution (# and %)* | 0-14 | 505,260 (15.9%) | ||||
| 15-19 | 162,175 (5.1%) | |||||
| 20-24 | 168,845 (5.3%) | |||||
| 25-64 | 1,681,415 (52.8%) | |||||
| 65-84 | 555,850 (17.5%) | |||||
| 85+ | 111,115 (3.5%) | |||||
| *Indicates where municipalities will have to source the data. | ||
| Characteristic | Data/Formula | Value |
|---|---|---|
| Current number of households* | Total | 1,160,895 (2021) |
| Anticipated number of households* | Total | 1,428,165 |
| Anticipated Household Age* | Average | 52.5 |
| Median | 50.2 | |
| Anticipated Households by Tenure* | Renter | 659,890 |
| Owner | 764,280 | |
| Anticipated Units by Type* | Total | 1,430,261 |
| Single | 642,555 | |
| Semi-detached | ||
| Row | ||
| Apartments in Buildings with Fewer than 5 Storeys | ||
| Apartments in Buildings 5+ Storeys | 787,706 | |
| Anticipated Units by Number of Bedrooms* | 1 bedroom | 417,963 |
| 2 bedroom | 404,320 | |
| 3 bedroom | 352,713 | |
| 4 bedroom | 253,168 | |
| 5 bedroom | ||
| Anticipated Households by Income* | Average | Not available |
| Median | 251,126 | |
| Very Low | 62,602 | |
| Low | 231,796 | |
| Moderate | 228,018 | |
| High | 506,921 | |
| Anticipated average household size* | Total | 2.19 |
| Draft approved lots by planned housing type* | Total | Not applicable |
| Draft approved lots by tenure* | Tenant | Not applicable |
| Owner | Not applicable | |
7.1 This final section aims to determine how your community anticipates using the results and findings captured in the Housing Needs Assessment to inform long-term planning as well as concrete actions that can address identified needs. Please use the following questions to describe how those linkages will be made.
How will this HNA inform your official community or development plan, housing policies and/or actions going forward?
For example, if the HNA identifies specific needs in your community across the housing spectrum – such as housing needed for priority populations, units for large households in denser form factors, more diverse structural types such as missing middle housing, or more affordable and higher-density housing near transit – how could actions and changes in policy and planning help address those needs?
The findings from this HNA demonstrate that there is a strong need for accelerating the delivery of housing supply in Toronto and will inform the development and/or ongoing implementation of a range of the City’s policies and housing plans, including:
How will data collected through the HNA help direct those plans and policies as they aim to improve housing locally and regionally, and how will this intersect with major development patterns, growth management strategies, as well as master plans and capital plans that guide infrastructure investments?
Most of Toronto’s future housing supply will need to be accommodated through intensive use of the existing land and building supply, including high-density residential development. The City has effectually built-out its land supply and has very limited opportunities for greenfield development sites. More intensive forms of development have many effects on land use and infrastructure planning, and therefore, the City as new projects are increasingly complex and contentious in a highly urbanized, built-out environment. The City’s infrastructure needs to be maintained, replaced and expanded to accommodate growth, which has major municipal finance implications. These considerations will inform future updates to the City’s Corporate Asset Management Plan, and annual Operating and Capital Budgets.
Based on the findings of this HNA, and particularly the projected housing needs, please describe any anticipated growth pressures caused by infrastructure gaps that will need to be prioritized and addressed in order to effectively plan and prepare for forecasted growth. This can relate to any type of enabling infrastructure needed for housing, including fixed and non-fixed assets, as well as social, community or natural infrastructure that your local government has identified as a priority for fostering more complete and resilient communities.
Existing and future Toronto residents rely on the City to deliver important services that depend on infrastructure such as transit, roads, bridges, water and wastewater assets, solid waste assets and emergency facilities. Quality of life for future generations of Torontonians also hinges on the City being able to secure and deliver community infrastructure, such as community centres, libraries and child care facilities, as well as digital infrastructure. Much of this infrastructure is critical to enabling the delivery of new housing supply. The City’s population and housing needs projections demonstrate that accelerating the delivery of this housing-enabling infrastructure will be necessary to deliver this needed housing supply.
Affordable Housing: A dwelling unit where the cost of shelter, including rent and utilities, is a maximum of 30 per cent of before-tax household income.
Area Median Household Income: The median income of all households in a given area.
Cooperative Housing: A type of residential housing option whereby the owners do not own their units outright. This would include non-profit housing cooperatives, as stand-alone co-operatives or in partnership with another non-profit, including student housing co-ops, as well as Indigenous co-ops, including those in partnership with Indigenous governments and organizations. This does not, however, include homeownership co-ops or equity co-ops that require an investment, which along with any profit earned, is returned to co-op investors.
Core Housing Need: Refers to whether a private household’s housing falls below at least one of the indicator thresholds for housing adequacy, affordability or suitability, and would have to spend 30 per cent or more of its total before-tax income to pay the median rent of alternative local housing that is acceptable (attains all three housing indicator thresholds).
Household: A person or a group of persons (other than foreign residents) who occupy a private dwelling and do not have a usual place of residence elsewhere in Canada.
Household Formation: The net change in the number of households.
Supportive Housing: Prioritizes people experiencing chronic homelessness and other vulnerable people who have the highest support needs. It provides long-term affordable housing and a diversity of customized support services.
Permanent Supportive Housing: Prioritizes people experiencing chronic homelessness and other vulnerable people who have the highest support needs. It provides long-term affordable housing and a diversity of customized support services.
Purpose-Built Rental: Also known as the primary rental market or secure rentals; multi-unit buildings (three or more units) which are built specifically for the purpose of providing long-term rental accommodations.
Short-Term Rentals: All or part of a dwelling unit rented out for less than 28 consecutive days in exchange for payment. This includes bed and breakfasts (B&Bs) but excludes hotels and motels. It also excludes other accommodations where there is no payment.
Suppressed Household Formation: New households that would have been formed but are not due to a lack of attainable options. The persons who would have formed these households include, but are not limited to, many adults living with family members or roommates and individuals wishing to leave unsafe or unstable environments but cannot due to a lack of places to go.
Missing Middle Housing: Housing that fits the gap between low-rise, primarily single-family homes and mid-rise apartment buildings, typically including secondary and garden suites, duplexes, triplexes, fourplexes, rowhouses and townhouses, courtyard housing, and low-rise apartment buildings of 4 storeys or less. These housing types provide a variety of housing options that add housing stock and meet the growing demand for walkability. The missing middle also refers to the lack of available and affordable housing for middle-income households to rent or own.