
Expanding Housing Options in Neighbourhoods is a City of Toronto initiative to facilitate more low-rise housing in residential neighbourhoods to meet the needs of our growing city. The City is working to expand opportunities for “missing middle” housing forms in Toronto, ranging from duplexes to low-rise walk-up apartments. All of these housing types can be found in many parts of Toronto today, but have historically been limited in where they can be newly built. Expanding Housing Options in Neighbourhoods is one solution among a range of City initiatives to increase housing choice and access and create a more equitable, sustainable city.
More information and details about opportunities for input can be found on the individual Priority Project study pages.
In support of each of the Expanding Housing Options in Neighbourhoods initiatives, demonstration plans were developed for those interested in missing middle housing. The plans illustrate some options for constructing these housing types in alignment with the City’s Zoning By-law and can be found on the Demonstration Plans webpage.
On November 20, 2024, the Province filed Ontario Regulation 462/24 regarding “ADDITIONAL RESIDENTIAL UNITS” (ARUs), made under the Planning Act. The Regulation affects the following zoning performance standards for some additional residential units: required angular planes, minimum separation distances, maximum lot coverage, maximum floor space index and minimum lot area. The Regulation came into force and effect on November 20, 2024.
City Staff have developed a coordinated approach to interpretation and implementation of the Regulation. City Planning staff are reviewing Ontario Regulation 462/24 and how it integrates with city-wide zoning. Staff intend to bring forward zoning by-law amendments to ensure alignment with the Regulation and to provide clarity for implementation in summer 2025. In the meantime, Ontario Regulation 462/24 should be read together with the Zoning By-law. Staff will also consider the impacts of Ontario Regulation 462/24 as part of the on-going Expanding Housing Options in Neighbourhoods (EHON) monitoring work.
Existing and prospective applicants should review the Ontario Regulation 462/24 to understand its impact on their application and consult professionals as needed. A Frequently Asked Questions section is also provided below.
Ontario Regulation 462/24 applies to the creation of an additional residential unit in buildings located on a lot that would result in a maximum of three residential units, including the additional residential unit. The Regulation outlines the following scenarios to which it applies:
The Regulation also applies to lots that have existing additional residential units, provided there are not more than three residential units on the lot.
The Ministry of Municipal Affairs and Housing has indicated that the Regulation “could facilitate the creation of additional residential units, such as basement suites and garden suites, by eliminating barriers. Removing these requirements could potentially reduce or eliminate the need for rezoning or minor variances, saving time and money and helping to build more homes.”
Yes. Secondary suites are one of the additional residential unit types contemplated by Ontario Regulation 462/24, provided there are not more than three residential units on the lot.
Yes. The Regulation applies to buildings or structures that contain additional residential units, including existing ones, and lots on which the additional residential units are located. For example, the Regulation would apply to a proposed addition to an existing building with two residential units, even if no further additional residential units are proposed provided there are not more than three residential units on the lot as outlined in the regulation.
The Regulation does not apply to new additional residential units added in scenarios where the result would be more than three residential units on a lot. For example, the Regulation would not apply to a laneway suite additional residential unit added to a lot with an existing triplex or the creation of a new fourth unit in a building to create a fourplex, as the result would be more than three residential units on the lot. In such cases, the regulations in Zoning By-law 569-2013, or other applicable by-laws, apply.
Buildings or structures with additional residential units, as outlined in the three scenarios above, may penetrate an angular plane. This means that a garden or laneway suite would not require an angular plane and the main walls are permitted to extend to the maximum permitted height.
A minimum separation distance of 4 metres is required in the creation of an additional residential unit where the Regulation applies. In Toronto, separation distances are applied between the primary residential building and a garden suite or laneway suite on the same lot.
Zoning By-law 569-2013 currently applies minimum separation distances for laneway suites and garden suites based on the height of the garden suite or laneway suite. In applying the Regulation to separation distance requirements, a garden suite or laneway suite can only be taller than 4 metres in height if a minimum separation distance of 7.5 metres is provided. If an applicant wanted to provide a separation distance of 4 metres, they could not exceed a height of 4 metres or, in the case of garden suites in Ward 19, 6.3 metres.
Where the City’s zoning regulations permit a separation distance of less than 4 metres, these regulations would prevail over the separation distance requirements of the Regulation.
Where this Regulation applies, a permitted maximum lot coverage of 45 per cent is applied to all buildings and structures on the lot, including both the primary building and ancillary buildings for the creation of an additional residential unit. Where the City’s zoning regulations permit a maximum lot coverage greater than 45 per cent, this would prevail over the lot coverage requirements of Ontario Regulation 462/24.
The permitted maximum lot coverage in Ontario Regulation 462/24 would not apply to areas of the City where there is currently no permitted maximum lot coverage regulations.
Where this Regulation applies, there is no maximum floor space index for the entire lot. This means that an applicable lot with a secondary suite in a detached house, semi-detached house or rowhouse will not be subject to a maximum floor space index limit. This is consistent with the existing multiplex, garden suite and laneway suite performance standards in the City-wide zoning by-law, which do not limit floor space index for these types of buildings.
Where this Regulation applies, the minimum lot area requirement for a building with an additional residential unit is the minimum lot area for the same building without an additional residential unit. For example, the minimum lot area requirement for a duplex would be the same as the minimum lot area for a detached house.
The Regulation does not address minimum lot frontage, minimum building setbacks or maximum gross floor area. The existing zoning by-law requirements for required minimum lot frontage, required minimum building setbacks, permitted maximum gross floor area and all other applicable zoning regulations continue to apply.
The Zoning by-law requirement for the interior floor area of an ancillary building containing a garden suite or laneway suite to be less than the gross floor area of the residential building on the same lot continues to apply.
Zoning regulations related to performance standards such as height and setbacks also apply. In addition, laneway suites are limited to a maximum size of 8 metres in width by 10 metres in length and garden suites are limited to a total building footprint floor area of 60 square metres.
City Staff are applying a coordinated approach to interpretation and implementation of the Regulation to active minor variance applications, building permit applications, and zoning reviews. Applicants with an active building permit or zoning review application that may be impacted by the Regulation may contact the assigned Zoning Examiner in Toronto Building to request an updated review. For questions related to active minor variance applications, please contact the assigned Committee of Adjustment staff.
City Planning staff are reviewing Ontario Regulation 462/24 and how it integrates with the City-wide Zoning By-law 569-2013. Staff intend to bring forward zoning by-law amendments to ensure alignment with the new regulation and to provide clarity for implementation in summer 2025. In the meantime, the Regulation should be read together with the Zoning By-law.
To check if your property is in a residential zone, please visit the Interactive By-Law Map. Use the search bar at the top of the webpage to enter your address, and a box containing key zoning information for your property will appear.
For general Toronto Building inquiries, including site-specific zoning interpretations, please contact Toronto Building Customer Service.
Ontario Regulation 462/24 was filed and came into force during ongoing monitoring work for garden suites and multiplexes, and as a result, some aspects of the monitoring programs will require additional review to appreciate the impacts of the provincial regulation. Any necessary amendments to Zoning By-law 569-2013 are intended be brought forward as part of final reports on the monitoring work in summer 2025. Planned engagement and consultation will resume in the coming months.
Where there is inconsistency with Chapter 900 Site or Area-Specific Exceptions in Zoning By-law 569-2013, the provisions of the Regulation prevail over the exceptions in the Zoning By-law. For example, if a site-specific exception in the Zoning By-law limits the maximum lot coverage to 35 per cent, the provincial regulation would prevail to allow for a maximum of 45 per cent lot coverage. However, if an exception permits a maximum lot coverage greater than 45 per cent, the exception would prevail.
If an application is now proposing to add a fourth (or more) unit to the lot, where previously the property was subject to the provisions in the Regulation, the new proposal would need to comply with the current zoning requirements. For example, if a previously approved duplex with a garden suite was constructed using the permissions in the Regulation, and is now proposing to convert the duplex to a triplex, thereby introducing a fourth unit on the lot, the entire proposal would need to comply with the current zoning regulations and would not benefit from the permissions under Ontario Regulation 462/24. Any existing feature that was only permitted through the Regulation would become a deficiency for the four-unit scenario, potentially requiring a variance through the Committee of Adjustment.
The Multiplex study focused on permitting multiplexes – residential buildings containing up to four units – across Toronto’s low-rise neighbourhoods. In May 2023, City Council adopted Official Plan and Zoning By-law amendments to permit multiplexes city-wide.
The Major Streets study focuses on permitting gentle density – missing middle housing – on major streets in low-rise neighbourhoods across Toronto.
The Garden Suites study focused on permitting garden suites on properties without lane access in most residential zones across Toronto. In February 2022, City Council adopted Official Plan and Zoning By-law amendments to permit Garden Suites city-wide.
The Local Neighbourhood Retail and Services is investigating ways to support the preservation and growth small-scale retail, service and office uses – primarily serving area residents – in the City’s designated Neighbourhoods. In July 2022, City Council adopted Official Plan and Zoning By-law amendments to expand neighbourhood retail and services uses and harmonize home occupation permissions city-wide.
Join us at our virtual meetings on September 17 from 6:30 to 8 p.m. and September 18 from 2 to 3:30 p.m. to share your final thoughts on the proposed amendments before it is considered by Planning and Housing Committee, or take our survey until September 30.
The Beaches-East York Missing Middle Pilot Project is reviewing appropriate City-owned sites in Beaches-East York (Ward 19) and working with the development industry and in consultation with the community to build “missing middle” demonstration projects.
In partnership with the City Planning Division, the Canadian Urban Institute (CUI) convened the EHON Roundtable, an advisory body comprised of individuals representing a broad range of backgrounds and equity-deserving groups, that discussed changes to Neighbourhoods policies in the Official Plan, multiplex housing permissions and design considerations, the desirability of expanding local retail and services, and rezoning for Major Streets.
With the goal of elevating lived experience into housing policy, the Final Recommendations Report summarizes the work of the EHON Roundtable and includes recommendations for the City to consider through the EHON initiative.
The Official Plan and Zoning By-law work together to implement the City’s vision for future land use and development:
The following graphics show how much of the City of Toronto’s total area is in each Official Plan land use designation and Zoning By-law zone category. One square represents one percent of the City of Toronto’s area.
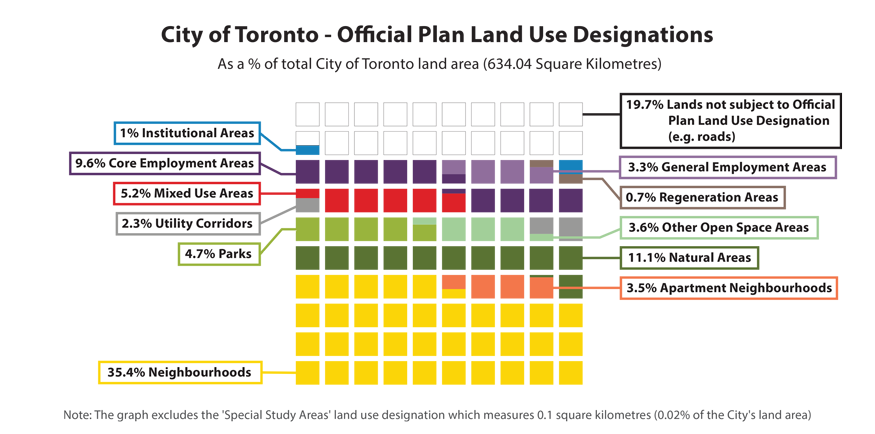
| Official Plan – Land Use Designation | Area (square kilometres) | Percentage of City of Toronto Land Area |
|---|---|---|
| Neighbourhoods | 224.5 | 35.4% |
| Apartment Neighbourhoods | 22.0 | 3.5% |
| Natural Areas | 70.6 | 11.1% |
| Parks | 29.7 | 4.7% |
| Other Open Space Areas (including Golf Courses, Cemeteries, Public Utilities) | 22.6 | 3.6% |
| Utility Corridors | 14.5 | 2.3% |
| Mixed Use Areas | 32.9 | 5.2% |
| Core Employment Areas | 60.7 | 9.6% |
| General Employment Areas | 21.2 | 3.3% |
| Regeneration Areas | 4.3 | 0.7% |
| Institutional Areas | 6.1 | 1.0% |
| Special Study Areas | 0.1 | 0.0% |
| Lands not subject to Official Plan Land Use Designation (e.g. roads) | 125.0 | 19.7% |
| Total City of Toronto Land Area | 634.0 | 100.0% |
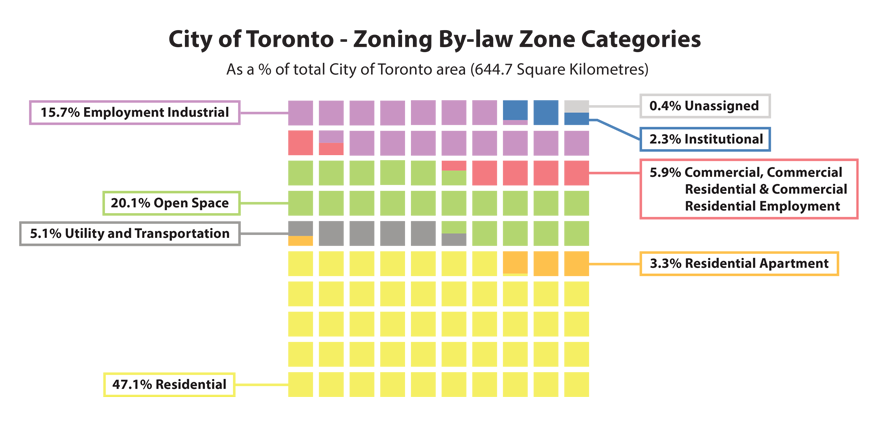
| Zoning By-law – Zone Category | Area (square kilometers) | Percentage of City of Toronto Area |
|---|---|---|
| Residential | 303.7 | 47.1% |
| Residential Apartment | 21.2 | 3.3% |
| Utility and Transportation | 33.0 | 5.1% |
| Open Space | 129.9 | 20.1% |
| Commercial, Commercial Residential & Commercial Residential Employment | 38.2 | 5.9% |
| Employment Industrial | 101.4 | 15.7% |
| Institutional | 14.7 | 2.3% |
| Unassigned | 2.3 | 0.4% |
| Total City of Toronto Area | 644.5 | 100.0% |
Although zoning by-laws must generally conform to the Official Plan, the exact breakdown of land areas in land use designations and zone categories varies due to differences in how these areas are drawn and measured. For example, Official Plan land use designations do not include rights-of-way, whereas zones are based on property boundaries extended to the centreline of adjacent streets.
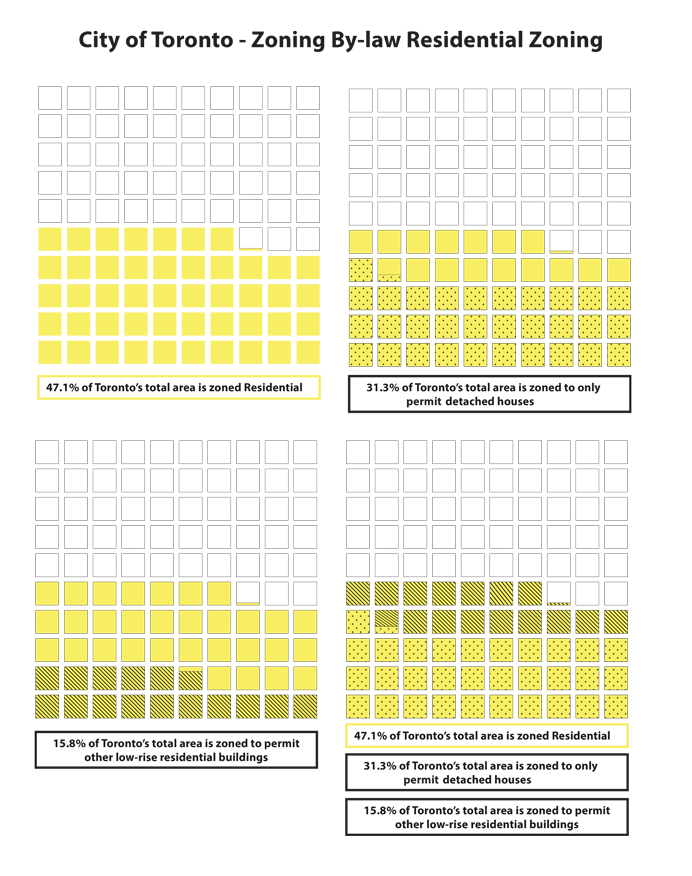
The graphic below illustrates the percentage of the City of Toronto’s total area subject to Residential zoning (47.1%). On its own, the Residential Detached (RD) zone makes up 31.3% of the city’s total area. 15.8% of the city’s total area consists of Residential zones (R, RS, RT and RM zones), most of which permit a variety of Missing Middle housing forms. Secondary suites are permitted in all Residential zones.
Notes:
Type (don’t copy and paste) your email into the box below, check the box next to the e-update description and then click “Subscribe”. You will receive an email with instructions to confirm your request.