The Local Emissions for Net Zero (LENZ) model plays a key role in informing the TransformTO Net Zero Strategy Action Plan (2026-2030). Like an advanced calculator, LENZ uses data about Toronto’s buildings, transportation, and waste to test how different actions reduce GHG emissions over time. LENZ modelling results quantify each action’s impact and guide priorities to support the TransformTO Net Zero Strategy. Read the LENZ Modelling Report for the Net Zero Strategy Action Plan (2026–2030).
The City of Toronto developed the Local Emissions for Net Zero (LENZ) modelling suite as a decision-making tool to test actions and policies that would help the City reach its net zero greenhouse gas (GHG) emission target by 2040. LENZ can model net-zero pathways or scenarios and estimate GHG emissions associated with everyday activities in Toronto such as heating and lighting of homes, driving cars, and taking public buses, among others.
Guided by the modelling results, the City can make informed decisions that are critical to meet its interim GHG emissions reduction targets identified in the TransformTO Net Zero Strategy, and offer opportunities for the City to course-correct its actions and ensure alignment with the long-term goal of achieving net zero by 2040. Specifically, the modelling results can be used to inform climate- and energy-related planning discussions, policies, and programs, including determining the feasibility of different sources of energy in Toronto.
LENZ was developed for both technical and non-technical audience especially those with policy development interest in the field of climate and energy.
LENZ is a cost optimization, open-source, modelling suite made up of three distinct but related components. LENZ is used to model under different conditions what technologies would make up the energy and waste systems in Toronto and what emissions those systems would produce directly or indirectly. An energy system includes any technology that converts energy from one form to another, such as a heat pump, a solar panel or something as small as a light bulb.
By modelling real-world operations, LENZ tests the City’s long-term action plans and interim GHG reduction targets and milestones to ensure that its journey towards net zero will deliver deep decarbonization. Data from LENZ can be used to inform climate and energy-related decisions.
Anyone interested in learning about LENZ and using it to explore climate action strategies can access LENZ for free without a license. Open-source models foster broader public accountability and transparency in developing credible and evidence-based climate action plans and offer members of the public opportunities to collaborate. LENZ is written in the popular Python programming language and users can manipulate the data through easy-to-use CSV files. LENZ manuals and videos are available to help guide any user, including members of the general public as well as policy makers and professional modellers.
The three modelling components that make up LENZ are:
While LENZ examines the energy system’s ability to meet energy demand on an annual basis similar to the previous round of modelling for the TransformTO Net Zero Strategy (NZS) using CityInsight, a new insight LENZ provides is the ability to examine the energy system at an hourly level to make sure peak load demands can be fulfilled. With its cost optimization feature, a new insight LENZ provides is the lowest cost option to achieve the targets.
Learn more about the insights LENZ can bring to the NZS from the video below or by referring to the non-technical manual.
The latest version of LENZ along with the native scenarios and their respective data can be accessed by emailing a request to the City of Toronto at LENZmodel@toronto.ca.
By requesting, downloading, and using LENZ, the user:
LENZ can be run by installing and running the components on personal devices. This requires the use of Python, Anaconda software, and a solver. More information about how to run LENZ can be found in the technical manual or in the video tutorials below.
| Video | Description |
|---|---|
| Installation Video | This video describes the steps to install the required platforms and how to configure them to run LENZ. |
| Running TEMOA-TO | This video describes the different scenarios native to LENZ, how to set the parameters for the scenarios, how to create the input for the TEMOA-TO model, and how to configure and run TEMOA-TO. |
| Data visualisation of TEMOA-TO | This video covers how to visualize the network diagrams for technologies and commodities in TEMOA-TO. |
| TEMOA-TO results dashboard | This video explains how to use the dashboard of macro indicators for TEMOA-TO as well as the results file generator. |
| Creating scenarios in TEMOA-TO | This video walks through the steps to configure and populate custom scenarios. |
| Running the Linking Tool | This video is about the Linking Tool. It explains how to set up the input, run the script, configure the output excel file, and view the output in the dashboard. |
| Running Silver-TO | This video explains how to set up the input for SILVER-TO, run the model, and finally visualize the results. |
LENZ was developed with both technical and non-technical individuals in mind. The manuals that meet different interests and level of knowledge can be downloaded through the following links:
This section contains Frequently Asked Questions (FAQ) about LENZ, its capabilities and limitations, and the requirements to run it.
Clarifications to other questions, which may not have been covered in the list of FAQs below, can be addressed by sending question(s) through email to LENZmodel@toronto.ca.
Local Emissions for Net Zero (LENZ) is a modelling suite the City of Toronto developed as a tool to address climate change. Using this tool, the City can predict its greenhouse gas (GHG) emissions from the energy and waste systems that support daily activities in the city. LENZ can be used to test the impact different actions and policies have on reducing GHG emissions below the targets the City has set in its TransformTO Net Zero Strategy (NZS).
LENZ is made up of three components:
Both the capacity expansion model and the production cost model in LENZ are cost-optimization models, meaning they provide the least-cost feasible solution.
LENZ is developed in Python, an open-source programming language that anyone can access in order to promote a network of shared ideas and expertise.
The LENZ modelling suite was developed to support analyses of implementing different actions from the NZS. The modelling suite will be used to periodically review the progress towards both long-term and interim GHG emission targets from the NZS as new data becomes available and determine if the actions identified in the NZS require fine tuning or if new actions are needed to reach Toronto’s ambitious targets.
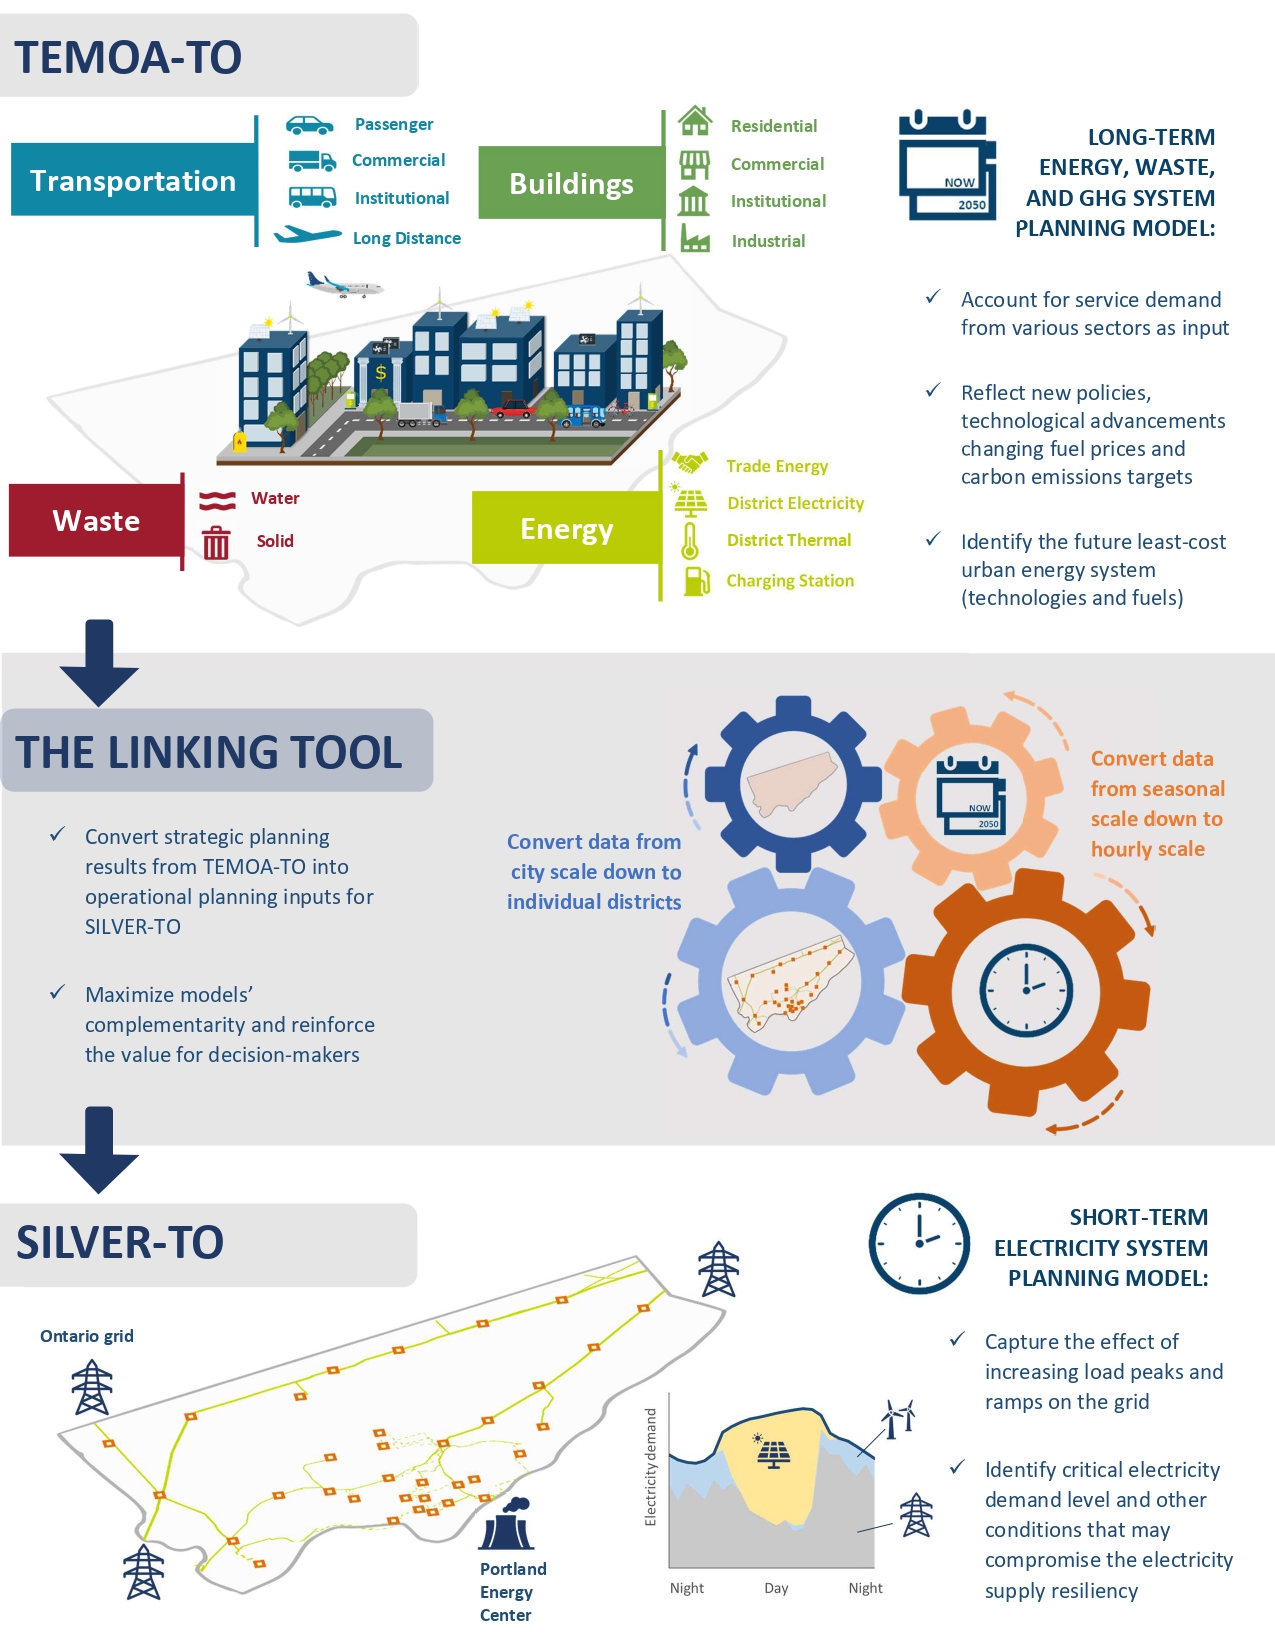
LENZ is made up of three different components because each provides specific pieces of information that, when combined, provide a complete picture. The capacity expansion model, TEMOA-TO, is based on the existing open-source model modelling framework Tools for Energy Model Optimization and Analysis (TEMOA). TEMOA-TO is an adaptation of TEMOA where modifications to the original framework were made to fit the characteristics of Toronto. It operates on a broad geographical and temporal scale. Specifically, it looks at the City as one geographical unit and over increments of time periods that vary from 1 to 5 years all the way to 2050. It is useful to analyze the long-term evolution of energy and waste systems and the emissions they produce to facilitate long-term strategies.
SILVER-TO, on the other hand, is a production cost model that is based on the existing open-source modelling framework Strategic Integration of Large-capacity Variable Energy Resources (SILVER) model. SILVER-TO is an adaptation of SILVER where modifications to the original framework were also made to fit the characteristics of Toronto. SILVER-TO provides insights on the electricity distribution system at a high spatial and temporal resolution. Specifically, it provides information at each transformer station zone within the city and for every hour of a specific year to ensure a balance between energy supply and demand.
Because TEMOA-TO and SILVER-TO operate at different time and geographical scales, an additional program (Linking Tool) was developed to convert the output from TEMOA-TO into an input for SILVER-TO. It does so by breaking down the TEMOA-TO output from the entire city into the geographical regions within the city that align with Toronto’s electricity distribution system and breaking down the annual energy demand and production to an hourly level.
In LENZ, TEMOA-TO is categorized as a capacity expansion model and SILVER-TO as a production cost model (SILVER-TO). The Linking Tool is neither and is a program that connects TEMOA-TO to SILVER-TO.
Capacity expansion models are used to study the long-term evolution of the energy and waste systems and their associated GHG emissions. Capacity expansion models identify the configuration of the energy and waste systems under different socio-economic conditions and policies that will meet the demand for certain services required by everyday activities that take place in the city. It typically provides insights into longer time frames and larger geographical areas. In the case of TEMOA-TO, the timeframes are 1 or 5 year increments in time all the way to 2050, and the geographical coverage is the entire city.
Production cost models identify least-cost operation strategies for the energy supply system and address power supply and demand balancing under variable operation conditions. Production cost models have a higher temporal and spatial resolution than capacity expansion models. They provide insights in detail on the energy production and distribution systems at the level of hours or shorter periods and for smaller geographic areas. In the case of SILVER-TO, the time resolution is an hour, and the geographical resolution is the coverage areas of the transformer stations around the city.
The CityInSight model was used in the development of the TransformTO Net Zero Strategy. It simulates GHG reduction actions over large geographic areas and longer timeframes and was used to develop specific policies that meet Toronto’s long-term GHG reduction targets. It forecasts the evolution of the energy and waste systems and their associated emissions over the years to meet the long-term demand for certain services under these policies, but it cannot provide insights on the operation of the energy system and its ability to supply energy to meet the demand that fluctuates hourly.
Also, because the CityInSight model is a simulation model, in order to find the least-cost solution, multiple simulations are required, after which the one that has the least cost is chosen. Because only a finite number of simulations can be completed, there is no guarantee that the solution chosen is the least-cost solution that can exist.
LENZ, on the other hand, leverages the broad geographic areas and longer timeframes of TEMOA-TO and the smaller geographic areas and shorter timeframes of SILVER-TO to capture both the evolution over the years and the operation by the hour of the energy and waste systems and their emissions. It also provides the least-cost solution by using an optimization package where an algorithm determines the absolute least-cost solution.
This combination provides sufficient information to design policies and programs that are critical to meeting long-term and short-term GHG emissions reduction targets, but it also ensures a balance between energy supply and demand at an hourly level at the least cost.
LENZ also includes a larger selection of technologies from which the different systems can be assembled than the selection that the CityInSight model used.
LENZ uses data from different sources.
The input that TEMOA-TO uses is:
SILVER-TO uses the capabilities of the electricity distribution grid as input and how the distribution grid is connected.
Finally, the Linking Tool takes as input the geographic distribution of the different areas of coverage of transformer stations in the electricity grid, population distribution, the citywide energy demand profile, and charging and discharging patterns of electric vehicles (EVs) and residential storage batteries.
When running LENZ, some data is exchanged from one component to the other. Specifically, the Linking Tool uses the output from TEMOA-TO and converts it into a format that aligns with the input required for SILVER-TO.
The data that the components of LENZ use come from different sources, such as datasets owned by the City and datasets from the CityInSight model. Some of the data also comes from open-source data from annual reports such as Via Rail, Ports Toronto and TTC; other modelling initiatives such as Google Environmental Insights; and private sector data.
LENZ can provide high-level output as well as detailed insights. Each component of LENZ has an Excel-based dashboard that provides some output, but the user can extract more information by processing the raw output data that is also found in Excel format. The types of output the dashboards provide are:
LENZ was developed as an open-source model written in Python to make it available to anyone who is interested in exploring the model and using it. While the model is accessible to anyone, running it does require some basic knowledge of programming, a fundamental understanding of energy systems and energy flow, as well as access to a relatively powerful computer.
Within the City of Toronto, the Environment & Climate (E&C) Division will be the main user of LENZ to support the implementation of the NZS. However, it can be used by other divisions that want to test out scenarios specific to the scope of their work. Externally, individuals from academia interested in pursuing research questions can use the model to do so.
Finally, LENZ can be used by individuals, companies, or organizations that have either a technical or policy development interest in the field of energy and climate. When using LENZ or any of its components, the user fully releases the City of Toronto from any liability that may arise from the use of LENZ or any of its components, including, without limitation, obtaining incorrect results from the use of LENZ or any of its components or taking actions based on those results. The user also fully waives any claim(s) the user may have against the City of Toronto as a result of using LENZ or any of its components, and the City will not be responsible for any results obtained by users or any action based on those results.
LENZ was developed as an open-source model to promote a network of shared ideas and expertise.
Users can use the model to determine the outcome of different scenarios based on their participation in the action plan or research interests. This will facilitate conversations among different users and allow them to explore synergies and opportunities to collaborate.
The three components of LENZ are written in open-source Python code. The TEMOA-TO and the SILVER-TO components are based on the open-source TEMOA and SILVER modelling frameworks, respectively.
While the SILVER modelling framework uses by default CSV files for input and output, the TEMOA modelling framework uses databases as input and saves the output in database format. To make LENZ user-friendly, all its components were designed to take input and provide output in the form of CSV files. The output of each component of LENZ can be viewed in the Excel-based dashboard dedicated to each. These dashboards are available with the source code and contain some of the most common outputs of interest.
The user can, in addition, easily manipulate the output from the CSV files or the dashboards to present the output on visualization platforms like Tableau.
LENZ comes with a non-technical manual and non-technical videos that provide a high-level understanding for individuals that have no technical background. It also has a technical manual and a series of technical videos for users who want to be more hands-on with LENZ.
The model does require some expertise in GHG/energy system modelling to formulate the different policies and targets into a format the model can process, as well as interpret its outputs.
The minimal hardware configuration required to run LENZ would be an I5 CPU with 8 GB of RAM or any equivalent configuration. Hardware with higher performance will reduce the time required for the model to complete a run.
The first essential piece of software required to run LENZ is Python version 3 or higher. Additionally, it is necessary to have the Anaconda software installed. Lastly, since the TEMOA-TO and SILVER-TO are optimization models, a solver is needed. There are many solvers that exist, some of which are open source and others that require licensing. The user has the flexibility to choose which solver to use. You can refer to the technical manual for further details.
Each component of LENZ has different degrees of flexibility.
TEMOA-TO computation can be run in three different modes: policy-based, target-based and hybrid. Two different scenarios were modeled in LENZ for each mode, resulting in a total of six scenarios.
While six scenarios were modelled using LENZ, users can design their own scenarios. Instructions can be found in the technical manual for users to design their own scenario. When designing scenarios, it is the responsibility of the user to ensure that the modelling is done correctly.
No two models are created equal. It is normal to have some differences in results when using different models. When LENZ was developed, the modelling results were benchmarked using policies from the NZS to produce results close to those obtained using the CityInSight model.
While both are energy and emissions models, one main modelling framework difference between CityInSight and LENZ is that the first is a simulation model, while the latter is an optimization model. Another main difference is that LENZ uses an updated library of technologies, including some technologies that were not considered in the CityInSight model (refer to question 5 for more details about the difference between CityInSight model and LENZ).
As newer data becomes available and more scenarios are explored, it is expected that results will continue to differ slightly. However, if sound assumptions and input are used and good modelling practices are applied, the results should not diverge significantly and are expected to remain within the uncertainties inherent to modelling.
While LENZ cannot assess the physical impacts of climate change such as damage due to floods and corresponding adaptation measures such as reinforcing the structure of seawalls for example, it can be used to analyze some operational risks (e.g., the higher-than-average electricity demand that results from heat waves or extreme cold). It can also be used to determine the potential impact of global warming on long-term energy demand and the additional load on the distribution grid that accompanies that demand.
Buildings, transportation, and waste are the predominant sectors for GHG emissions in most cities. The sectors modeled in LENZ, specifically TEMOA-TO, include these three sectors, which align with the Sector-Based Emissions Inventory the City publishes annually. In addition, as local energy generation is expected to grow, TEMOA-TO includes an element representing the energy sector, both distributed energy resources and energy imports.
Corresponding with the GHG Protocol for Cities (GPC), LENZ focuses on emissions generated within the geographic limits of Toronto (Scope 1) and emissions due to imported electricity (Scope 2). LENZ does not cover Scope 3 emissions and cannot evaluate GHG emissions based on the consumption of imported goods.
Data from TEMOA-TO can be broken down using the Linking Tool. The default breakdown of the data from TEMOA-TO in LENZ is dictated by the geographical areas required by SILVER-TO and is based on the geographical coverage of transformer stations around the city. The user, however, can choose different geographical boundaries within the city of Toronto (e.g., wards, neighborhoods) or geographical parcels based on different equity metrics (Neighborhood Improvement Areas). Once this information is broken down to the resolution of choice, it can be used to look at challenges such as energy poverty and access to renewable energy technologies. Unless identical to the coverage areas of transformer stations required by SILVER-TO as input, the output of different methods cannot be used by SILVER-TO.
LENZ, specifically TEMOA-TO, looks at different energy sources. This includes fossil fuel derivatives, biofuels, electricity (either generated in different types of power plants or from renewable resources), natural gas, renewable natural gas and hydrogen. SILVER-TO only considers electricity.
The main component of LENZ that contains an exhaustive library of technologies is TEMOA-TO. Examples of such technologies are electric vehicles, appliances, lighting, and heating and cooling equipment.
The transformation needed to meet the long-term GHG goals requires significant changes and investments to be made. These investments are in the form of capital costs, fixed annual costs, and running costs. LENZ, mainly through TEMOA-TO, determines the energy system that will convert the available energy resources to meet the demand of the different sectors (buildings, transportation, and waste). TEMOA-TO can find different energy systems by combining technologies from the wide selection of technologies available, but since only one combination can be implemented, TEMOA-TO chooses the combination that is the least costly to implement. To do this, it relies on an optimization package that uses an algorithm that determines the least-cost solution based on the net present value (NPV).
SILVER-TO optimizes for cost by minimizing the transmission cost of electricity and deciding the cheapest route in the distribution grid to supply the required electricity to each transformer station area.
LENZ was developed to optimize for cumulative costs (capital costs, fixed costs and variable costs). The user can choose a different objective parameter; however, this will require changes to the core code of TEMOA and advanced programming skills.
You can direct your questions to LENZmodel@toronto.ca and a member from the Policy and Research team will get back to you.
Note: By requesting, downloading, and using LENZ, the user fully releases the City of Toronto from any liability that may arise from the use of the model, including without limitation, obtaining incorrect results from the use of the model or taking actions based on those results; and fully waives any claim(s) the user may have against the City of Toronto as a result of using the model.