The City of Toronto's 2023 Sector-Based Emissions Inventory (SBEI) tracks Toronto’s progress towards reducing its greenhouse gas emissions from three key sectors: buildings, transportation and waste. See the SBEI interactive dashboard in detail.
Toronto’s greenhouse gas (GHG) emissions increased in 2023. The 2023 emissions inventory shows that, while overall emissions increased slightly, Toronto reached the lowest level of GHG emissions per capita since records began in 1990 (excluding 2020, an irregular year due to the COVID-19 pandemic). Though there is an overall downward trend in emissions over time by sector (buildings, transportation and waste) since 1990, the pace of emissions reduction will not meet the 2025 or 2030 community-wide targets. Toronto must continue to scale up its GHG emissions reduction programs and initiatives to reach its interim targets and net zero by 2040.
The City’s 2023 Sector-Based Emissions Inventory (SBEI) tracks Toronto’s progress towards its GHG emissions reduction targets and identifies direct and indirect greenhouse gas emissions from three key sectors: buildings, transportation and waste. The sources that contribute the largest percentage of emissions in Toronto are natural gas heating in residential buildings (26 per cent of Toronto’s community-wide emissions) and gasoline combustion in passenger vehicles (22 per cent of emissions).
Toronto’s future sector-based reduction targets from 1990 levels are: 45 per cent by 2025, 65 per cent by 2030, and net zero by 2040. The 2025 target of a 45 per cent emissions reduction from 1990 levels is not feasible given the current emissions level and the required mitigation trajectory until that year.
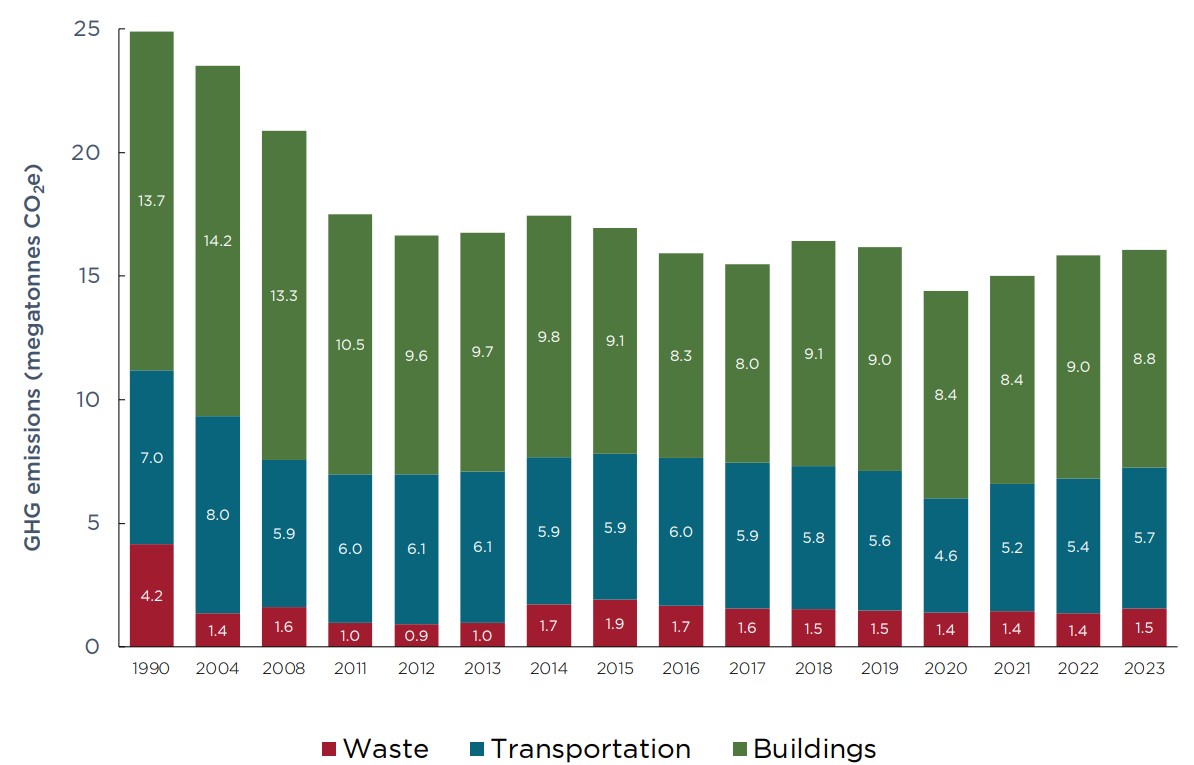
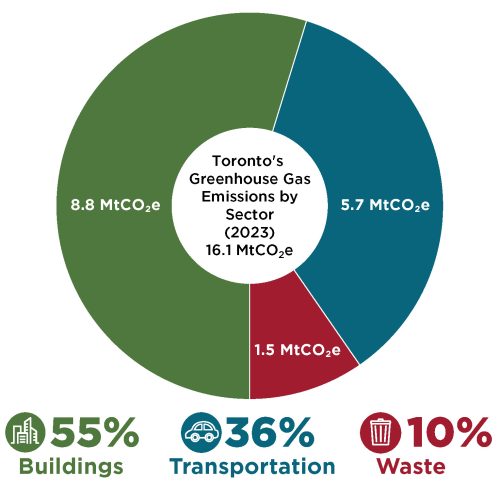

Buildings remained the primary source of GHG emissions in Toronto in 2023 at 8.8 MtCO2e, accounting for 55 per cent of community-wide emissions, decreasing slightly from 9 MtCO2e (57 per cent) in 2022. The largest source of these emissions was fossil (natural) gas heating in residential buildings, which accounted for 26 per cent of community-wide emissions in 2023. Although there was a seven per cent reduction in fossil (natural) gas emissions from residential buildings in 2023 from 2022, these emissions have remained relatively stable since 1990.

In 2023, the City of Toronto’s corporate emissions from City-owned buildings, vehicle fleets and waste were 0.89 MtCO2e, accounting for about six per cent of Toronto’s community-wide emissions. Corporate emissions increased four per cent (from 0.85 MtCO2e) since 2022 and were seven per cent below 2008 levels.
A concerted effort will be necessary to reach the 2030 target of a 65 per cent reduction in GHG emissions from such baseline while providing services for a growing population. Corporate emissions were roughly equally distributed across the buildings, transportation, and waste sectors in 2023. Although overall emissions were relatively equal across these sectors, the City has more control of its own operations and has put into place policies and processes to catalyze its decarbonization efforts. Supported by these tools, the City aims to reduce its use of fossil (natural) gas to heat City- and TCHC-owned buildings and power fleet vehicles (diesel and gasoline).
As a Global Covenant of Mayors signatory, the City of Toronto has been disclosing its GHG emissions inventory and its climate mitigation and adaptation actions annually to the Carbon Disclosure Project (CDP) in order to share Toronto’s progress and benchmark against other cities facing similar challenges.
For the sixth year in a row, the City of Toronto is recognized on the 2024 Carbon Disclosure Project (CDP) Cities “A” List for its leadership and transparency on climate action. Toronto was one of 112 cities globally to receive an “A” rating. At the time of 2023 SBEI report publication, the 2025 CDP results have not been released.
The City follows the Greenhouse Gas Protocol for its sector-based emissions inventory.