Toronto’s first consumption-based emissions inventory (CBEI) identifies opportunities to help reduce Toronto’s carbon footprint within the city and across the globe.
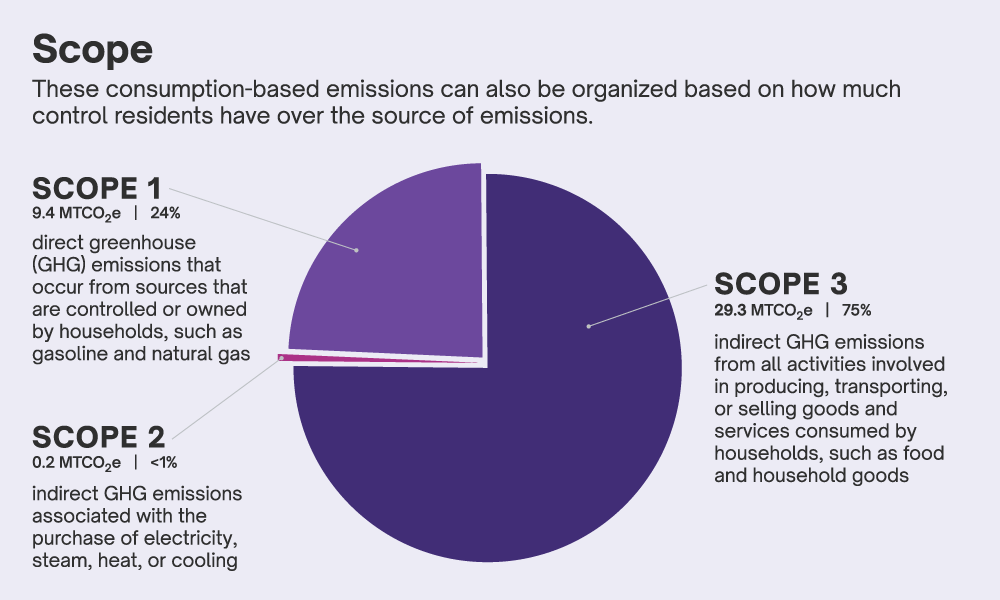
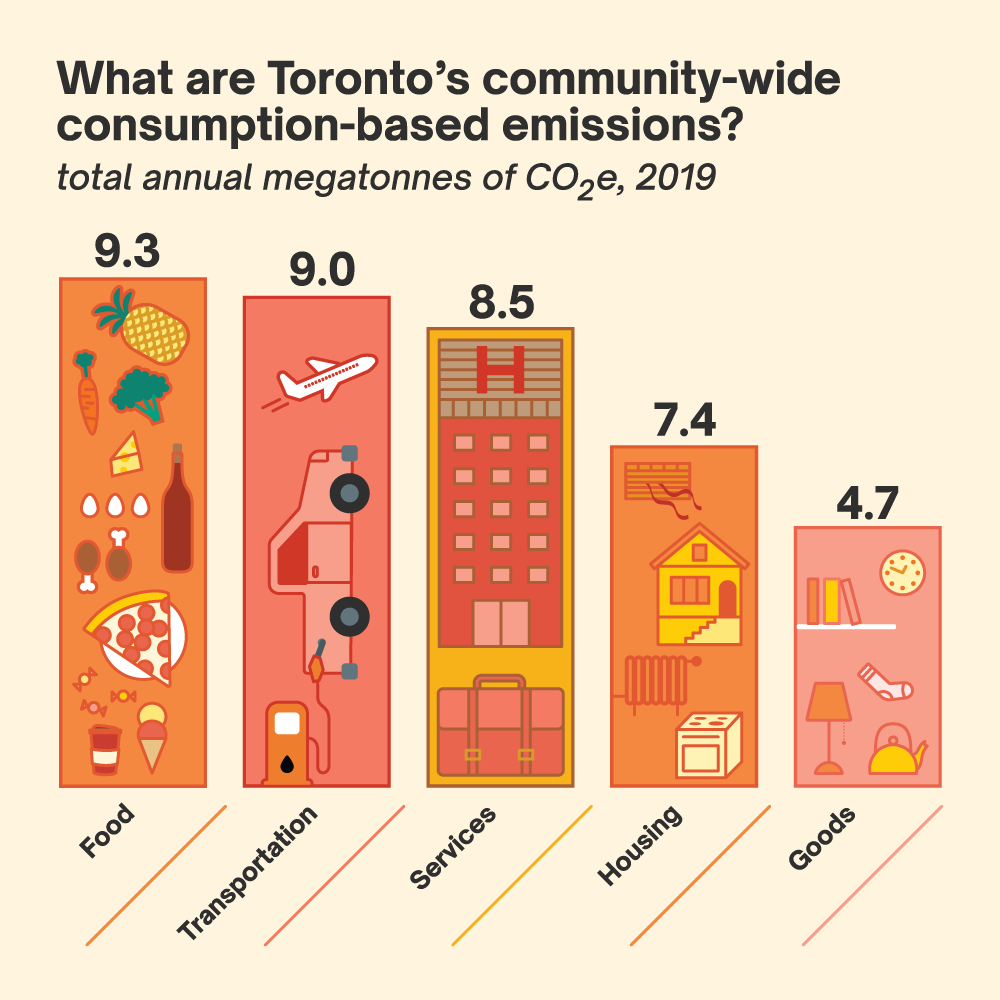
Toronto’s CBEI estimates the total greenhouse gas (GHG) emissions associated with consumption – that is the emissions associated with producing, transporting, using, and disposing of goods and services consumed by Toronto residents over the course of a year. A CBEI captures emissions associated with the purchase of goods and services by Toronto residents, including the food that appears on supermarket shelves, consumer goods purchased at a department store and larger items like personal vehicles. Typically, for these products and services, the majority of GHG emissions are generated outside of Toronto’s geographic boundary because many of them are not produced in Toronto.
Complementary to CBEI, a sector-based emissions inventory (SBEI) measures the GHGs attributable to emissions generating activities taking place within the geographic boundary of the city, as well as some indirect emissions from waste produced in the city, and transmission of electricity into the city boundary in a given time period (typically one year).
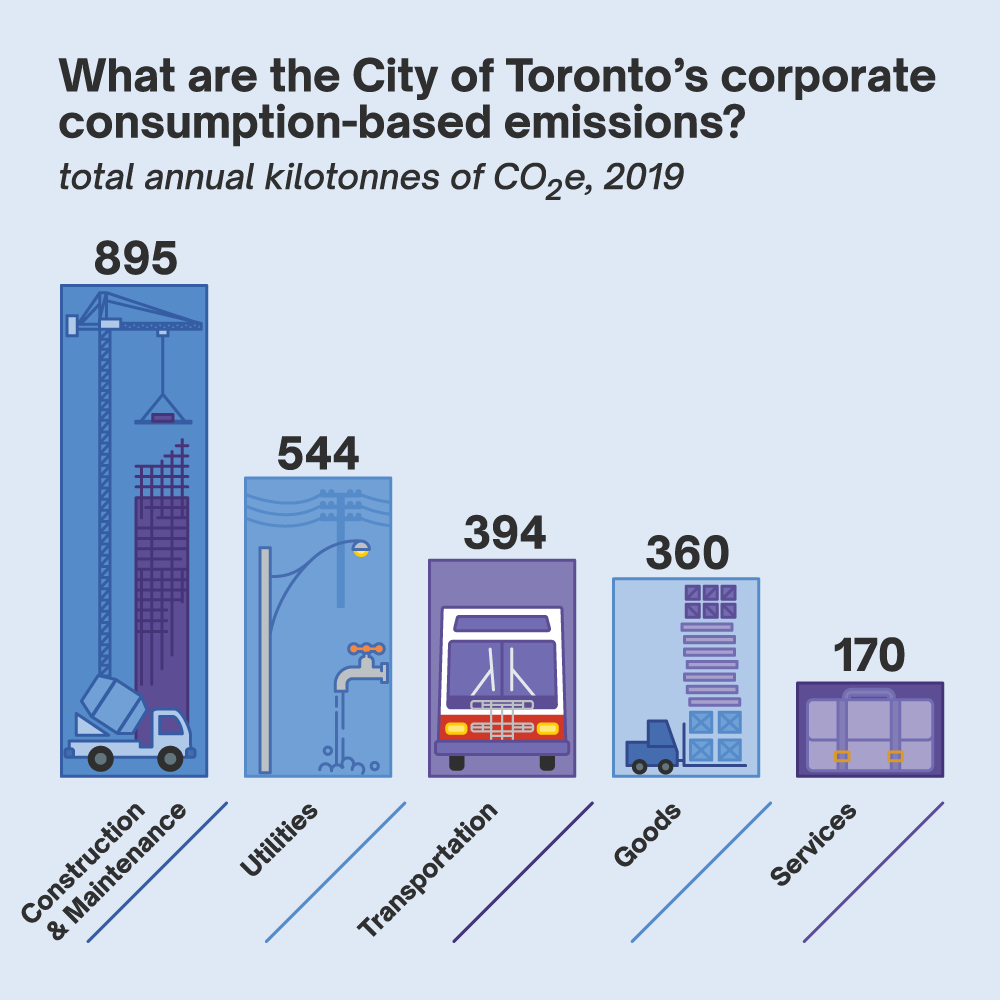
Toronto’s first CBEI report serves as a baseline study for the calendar year 2019 using the best currently available data for the city. Two baselines were generated as part of the CBEI – a baseline for community-wide emissions, and a separate baseline for emissions from the City government itself (corporate emissions). Observations from an additional analysis regarding emissions from embodied carbon found in Buildings and Linear Infrastructure Emissions was also generated to complement the information found in the community and corporate CBEIs.
| Inventory Type | Canada | Toronto |
|---|---|---|
| CBEI | 14.3 | 13.1 |
| SBEI | 19.4 | 5.4 |
To view the source for SBEI on page 3 (21) read Government of Canada Publications.
CBEIs are developed using a wide range of data from local, national, and international sources. These data inform computer models that are used to predict consumer behaviour and their corresponding impacts from material consumption. However, due to limited data availability, the data sources and models used in Toronto’s CBEI were based primarily upon U.S. data.
Because of the current limitations on data availability and evolving CBEI methodology, Toronto’s next CBEI will be produced in 2027, following the release of the 2026 national census when data will be comparable to the 2019 CBEI for progress monitoring.
Nevertheless, the findings of Toronto’s inaugural CBEI can still be incorporated into policy, program, and project activities across the city. The information in the report could be used to consider near term policy- or category-specific targets, or even set targets based upon readily available, actionable data that indicate changes in consumption-based emissions without directly monitoring those emissions (“actionable data indicators” or ADI).
For instance, work has already been initiated specific to food-related emissions as part of the City’s commitment to reduce the emissions from the food that it procures. In 2019, the City of Toronto became a signatory of the World Resources Institute (WRI)'s Cool Food Pledge and pledged to decrease emissions from public food procurement by 25 per cent by 2030 relative to 2019 levels (2019.HL10.2). The City continues to calculate and report on an annual basis to the Cool Food Pledge and C40 on progress towards Toronto’s food procurement-related commitments and will include these updates in TransformTO’s Net Zero Status Updates (2023.IE6.6).
With respect to building emissions, in 2022, City Planning updated the Toronto Green Standard Version 4 (TGS v4) which applies to new buildings and included revisions in the “Embodied Emissions in Materials” performance measures which apply to the emissions produced by materials used to construct buildings and limit these emissions to 350 kg CO2e/m2 for Tier 2 mid-high rise, non-residential buildings and City-owned facilities and 250 kgCO2e/m2 for Tier 3 mid-high rise and non-residential buildings (2023.PH3.19). Both Environment & Climate division and City Planning continue to refine and adjust actions being taken to address embodied carbon in buildings as further refinement and studies become available.
While methodologies and practices for tracking consumption-based emissions is an emerging field, it shows potential for unique opportunities to support local government in future with developing targets, policies, and programs that can help shift Toronto residents towards more responsible production and consumption of goods and services in order to reduce Toronto’s global carbon footprint.