Learn more about City-run events and programs that celebrate biking and promote safe cycling in Toronto. Data about bicycle counts, annual growth of the cycling network, and cycling behaviour in Toronto can also be found in survey results and reports below.
Bike Month is a month-long celebration of all things cycling in the Greater Toronto & Hamilton Area (GTHA), as well as the cities of Greater Sudbury and London. Smart Commute invites you to get on your bikes and ride, whether for commuting to work, errands, visiting friends/family or for fun. This is a great opportunity for people to try riding a bike for the first time, learn new skills, or simply have fun and connect with new people. It’s about incorporating cycling in all its forms into your routine, whether you’re trying an e-bike for your summer commute or spending family time exploring trails in your neighbourhood.
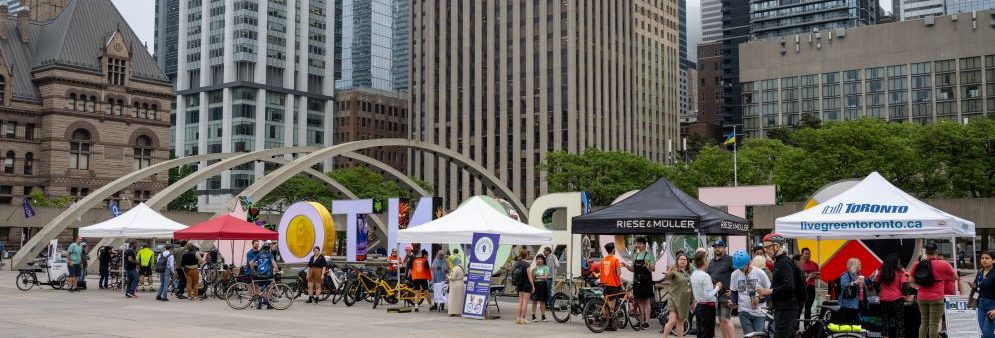
The annual Bike to Work Day Group Commute took place on Thursday, June 4, 2026.
For more information about the campaign, visit Bike Month.
Click the links below to view an annual summary of new bikeways in Toronto categorized by type, overall kilometres of bikeway upgrades, and bike parking and Bike Share Toronto statistics.
Cycling is an important recreational outlet and essential mode of travel throughout the city, according to a 2025 public opinion survey conducted on behalf of the City of Toronto. Cycling for utilitarian purposes remains a growing choice among survey respondents. 25.7 per cent of survey respondents stated that they ride a bike for shopping, running errands or visiting friends, compared to 24 per cent in 2023.
The 2025 survey also emphasized that new cycling infrastructure improved respondents’ general perceptions of safety in their communities. Among half of all survey respondents who noticed new cycling-friendly infrastructure in their area over the last two years, 89.1 per cent said they use the new infrastructure at least sometimes, and 69.1per cent said the new infrastructure had a positive effect on the physical appearance, perceived safety, ease of accessing services there, and/or ease of commuting.
The research team and Research Co. conducted an online survey of 1,660 Toronto residents between November 5, 2025 and January 9, 2026. The sample is geographically and demographically stratified to be representative of Toronto.
Download the data from the report below:
Dive into the previous survey data here:
The Toronto Cycling Network dataset contains the following types of bikeways: cycle tracks, bicycle lanes (including buffered bike lanes and contra-flow bike lanes), neighbourhood routes with sharrows (including wayfinding sharrows), multi-use trails (including off-road and in-boulevard), and signed cycling routes.
Click the link above to visualize the data as a grid, graph, or cycling network map, or to download it in several formats, including as a Shapefile or CSV.
The City conducted a Micromobility Cordon and Classification Count in the fall of 2022. A cordon count is a study that measures the number of users that cross a prescribed boundary in certain locations within the City. The count recorded the number of people cycling and other micromobility users crossing two boundaries – an inner cordon bounded by Spadina Avenue, Bloor Street, Jarvis Street, and Queens Quay Boulevard, and an outer cordon bounded by Dufferin Street, the CP Rail Corridor (roughly adjacent to Dupont Street), the Don River, and Lake Ontario. It classified people cycling and other micromobility users crossing the cordon boundaries according to the type of bicycle or other micromobility device being used (e.g. e-bicycle, electric kick scooter, Toronto Bike Share), the apparent trip purpose (e.g. food delivery), and the type of infrastructure used (sidewalk, bike lane, or mixed-traffic).
The cordon count supports:
A report on the study is available here.
The full Bicycle and Micromobility Cordon Count and historical Bicycle Cordon Count: 2010, 2013, 2014 datasets are available on Open Data.
CAN-BIKE is the only accredited program that teaches cycling rules and safety led by certified CAN-BIKE instructors.
Instructors are knowledgeable about the Highway Traffic Act and teach cycling skills such as anticipating traffic dynamics, recognizing road hazards, and collision-avoidance techniques.